![]()
Therapeutic Area User Guide for Huntington's Disease
Version 1.0 (Provisional)
Notes to Readers
- This is the provisional version 1.0 of the Therapeutic Area User Guide for Huntington's Disease.
- This document is based on SDTM v1.5, SDTMIG v3.2, SDTMIG-PGx v1.0, and SDTMIG-MD v1.0 (provisional).
Revision History
| Date | Version |
|---|---|
| 2018-10-01 | 1.0 Provisional |
© 2018 Clinical Data Interchange Standards Consortium, Inc. All rights reserved.
1 Introduction
The Therapeutic Area Data Standards User Guide for Huntington's Disease (TAUG-HD) was developed under the CDISC Standards Development Process. It focuses on clinical trials in patients with Huntington's disease. The TAUG-HD was funded by the CHDI Foundation as part of the collaborative efforts between CHDI and Critical Path Institute (C-Path).
The development of this standard included collecting input from various stakeholders to ensure the standard is as thorough as possible. A multitude of volunteers and experts provided resources and input to support the development of this standard. The goal of this standard is to identify a core set of clinical therapeutic area concepts and endpoints for targeted therapeutic areas and translate them into CDISC standards to improve semantic understanding, support data sharing and facilitate global regulatory submission. As with all CDISC therapeutic area standards, the purpose of this standard is to describe how to use CDISC standards to represent data pertaining to a targeted therapeutic area—in this case, Huntington's disease.
It is important to note that the inclusion or exclusion of concepts in this TAUG has nothing to do with whether such concepts may, should, must, must not, should not, or need not be collected in any given Huntington's disease study. CDISC is not a regulatory, clinical, or medical expert or authority; CDISC standards are not guidelines for which data to collect, how to run clinical trials, or how to treat patients.
1.1 How to Read this Document
- First, read the Study Data Tabulation Model (SDTM), the SDTM Implementation Guide for Human Clinical Trials (SDTMIG), the SDTMIG for Medical Devices (SDTMIG-MD), and the Pharmacogenomics/Genetics Implementation Guide (PGxIG) to gain some familiarity with the model used in this document and its general implementation in human clinical trials. These standards are the basis of this therapeutic area user guide (TAUG) and are available at http://www.cdisc.org/sdtm, https://www.cdisc.org/standards/foundational/sdtmig and https://www.cdisc.org/standards/foundational/pgx, respectively.
- Next, read Introduction to Therapeutic Area Standards (https://wiki.cdisc.org/x/SSy8AQ) to know what to expect from this TAUG. The CDISC Training Campus (https://www.cdisc.org/education/online-courses) has a free module you can access as well.
- Read this guide all the way through (without skipping any sections) at least once.
- Finally, revisit any sections of particular interest as the need arises.
Some things to bear in mind while reading this document:
- This document does not replace or supersede the foundational CDISC standards or their implementation guides, and should not be used as a substitute for any other CDISC standard.
- This document does not repeat content already published in another CDISC standard.
- This document is not and does not try to be an exhaustive documentation of every possible kind of data that could be collected in relation to Huntington's disease. The team does not know the extent of every possible kind of data that could be collected in relation to Huntington's disease. They have tried to focus on those areas that CHDI subject matter experts have identified as most likely to be relevant and useful.
- The advice and examples presented in this document are influenced by ongoing internal standards development at CDISC. If a modeling approach seems inconsistent with a published standard, it may be a genuine error, but it could also be a reflection of potential or upcoming changes to the standard. Corrections for errors identified after publication can be found on the Errata page (https://wiki.cdisc.org/x/BUs8Aw) for the document.
- The examples in this document use CDISC Controlled Terminology where possible; some values that seem to be controlled terminology may still be under development at the time of publication, or even especially plausible "best-guess" placeholder values. Do not rely on any source other than the CDISC value set in the NCI Thesaurus (http://www.cancer.gov/research/resources/terminology/cdisc) for controlled terminology.
- With time, parts of this TAUG may become outdated. Please bear in mind the release date when contrasting advice and modeling in this guide against that in other CDISC standards.
Draft standards of interest to this document are listed at: Draft Standards of Interest to Huntington's Disease (https://wiki.cdisc.org/x/AKyzAg) .
All general caveats for TA standards given in the Introduction to Therapeutic Area Standards (https://wiki.cdisc.org/x/SSy8AQ) apply to this document.
1.2 Organization of this Document
This document is divided into the following sections:
- Section 1, Introduction, provides an overall introduction to the purpose and goals of the Huntington's disease project.
- Section 2, Overview of Huntington's Disease, provides an overview of what Huntington's disease is and who it affects.
- Section 3, Subject and Disease Characteristics, discusses the role of family history and genetics in Huntington's disease.
- Section 4, Disease Assessments, provides information on data used to evaluate how a subject is progressing over the course of a study.
- Appendices provide additional background material and describe other supplemental material relevant to Huntington's disease.
1.3 Known Issues
- The non-standard variable "SNR" (signal to noise ratio) is shown as a "qualifier of results" in the NSV table for the nv.xpt example in Section 4.3.2, Magnetic Resonance Spectroscopy (MRS), and is replicated in each row of the metabolite results. In fact, SNR qualifies the entire spectroscopy dataset from which these individual results were obtained. There is currently no good way to represent qualifiers of data at this level.
- NVTESTCD/NVTEST terminology shown in the example in Section 4.3.2, Magnetic Resonance Spectroscopy (MRS), overlaps with some existing controlled terminology for LB. Use of the same TESTCD and TEST terminology in multiple codelists is generally avoided, but after careful consideration and public comment the decision was made to represent these data in NV, resulting in duplication of these terms in codelists for NVTESTCD and NVTEST.
2 Overview of Huntington's Disease
Huntington's disease (HD) is a genetic disease caused by a mutation in the huntingtin (HTT) gene. It is typically inherited in an autosomal dominant fashion from an affected parent, but a small minority of cases can be caused by a de novo mutation in an individual without a family history. The disease causes the progressive degeneration of neurons in the brain that results in cognitive impairment, psychiatric disorders, and motor dysfunction. Symptoms in affected individuals can present at any age, but onset most often occurs between the ages of 30-50. A trend in earlier onset may be present in subsequent generations in some families. There is no cure; current therapies focus on improving quality of life. Typical life expectancy from the time of onset is in the range of 15-20 years. Prevalence is similar for men and women.[1]
3 Subject and Disease Characteristics
Subject and disease characteristics generally includes events and activities that have affected the subject prior to the study. For Huntington's disease studies, such information will include subject characteristics such as genetics and family history.
3.1 Genetics and Family History
Huntington's disease (HD) is a hereditary, monogenetic autosomal-dominant neurodegenerative disorder. Monogenetic refers to the fact that a variant of a single gene—the huntingtin (HTT) gene—is sufficient to bring about the symptoms and signs of HD. In turn, the monogenetic nature of HD implies that individuals who develop symptoms and signs reminiscent of HD but do not have this gene variant (allele) by definition do not suffer from HD, despite the fact that they may look and behave like HD patients. Autosomal-dominant refers to the fact that
- The HTT gene does not reside on 1 of the sex chromosomes (X- or Y-chromosomes), but rather an autosomal chromosome (in this case, chromosome 4). Therefore, individuals of either sex have an equal/identical chance of inheriting an HD-causing allele transmitted by an affected parent.
- One single mutant allele is necessary and sufficient to cause disease (thus, a dominant allele).
The HTT gene codes for the huntingtin protein. The gene sequence includes a series of tandem trinucleotide repeats consisting of consecutive cytosine, adenine, and guanine (CAG) residues. In subjects who develop Huntington's disease, the CAG trinucleotide repeat has an excessive length. There is an inverse correlation between an increasing number of CAG repeats (within the HD-causing range) and age of disease onset. HD is, in most patients, of mid-life onset and of full penetrance. As a consequence of mid-life onset of symptoms and signs, many carriers of an HD-causing allele in their HTT gene have already decided to have children many years before they become aware that they inherited this allele.
To survey individuals potentially at risk for inheriting the CAG-expansion mutation, a carefully obtained family history is critical. Full penetrance of the HD-causing allele implies that each and every individual who inherits such an allele will eventually develop HD. One consequence of the full penetrance of the HD-causing allele is that most people affected with HD have a "positive family history" (i.e., a relative in the direct bloodline who was affected by HD as well). In practice, however, it is often difficult to be sure that abnormalities reported in relatives are indeed related to HD, in particular when referencing periods when confirmation by genetic testing was not available. Therefore, in obtaining a family history, raters are asked to assess HD status, designated as ranging from "unknown" to "manifest carrier"; in addition, the degree of certainty of the rater's assessment may be recorded. Family history analysis allows investigators to identify families with apparent lack of relatives affected by HD ("negative family history"). In some families, an apparently negative history may reflect censored lifespans of the older generations precluding the clinical, overt manifestations of HD. Therefore, the age at death of all family members is recorded. In others, false paternity may be the root course of a negative family history. However, in yet other families, parents may harbor a non HD-causing allele in the mutable range (i.e., 27 to 35 CAG repeats in the HTT gene), giving rise to offspring with CAG expansion sizes in the HD-causing range (≥36 CAG repeats). To identify false paternity or the presence of expandable alleles requires examination of DNA obtained from the parents. It is therefore useful to know whether DNA from relatives is available.
Understanding patterns of inheritance in families may be of interest in some studies. No dataset examples of family history are provided in this TAUG. For guidance on how to represent data collected about non-study subjects associated with a subject in the study, see the SDTM Implementation Guide: Associated Persons (SDTMIG-AP; available at https://www.cdisc.org/standards/foundational/sdtmig). Further, single nucleotide polymorphisms (SNPs) are common data elements used in neurodegenerative clinical trials. No dataset examples of SNPs are provided in this TAUG, but guidance on how to represent such data is described in the SDTM Implementation Guide for Pharmacogenomics and Pharmacogenetics (SDTMIG-PGx v1.0; available at https://www.cdisc.org/standards/foundational/pgx).
Genetic testing of the HTT gene may be performed for the following reasons:
- to diagnose a subject or to confirm diagnosis of HD,
- to assess the subject's risk of developing HD at some point in life due to family history, or
- to estimate disease burden.
The genetic test focuses on the number of CAG trinucleotide repeats, and can be interpreted as shown in table below.[2] Note that any subject with an HD-causing allele is considered an HD-causing allele carrier (HDCAC) because for at least some portion of their lives they do not yet have manifest HD.
Table. HD-causing and Non HD-causing Alleles
| HD-causing alleles | |
|---|---|
| >39 CAG repeats | Full penetrance: This range of CAG repeat length is associated with high certainty of developing HD |
| 36 to 39 CAG repeats | Reduced penetrance: Subjects are at risk for developing HD, but may never show symptoms, depending on longevity (may die of other causes before developing HD). |
| Non HD-causing alleles | |
| 27 to 35 CAG repeats | Intermediate or mutable non-HD causing alleles: Subjects in this range are regarded as not at risk for HD, but, due to instability in the CAG repeat portion of the gene, they may be at risk of having a child with an HD-causing allele. |
| 26 or fewer CAG repeats | Subjects with 2 alleles in this range of CAG repeat length are regarded as not at risk. |
It is important to note that sometimes 1 or more CAA trinucleotide repeats occur within the CAG repeat region of the gene, and sequencing analysis provides a more accurate and direct counting of CAG repeat numbers.
Example
This example demonstrates 2 methods of determining the number of CAG repeats within the HTT gene: capillary electrophoresis and sequence analysis. The combination of PFTEST ("Microsatellite Repeats" in all cases), PFTSTDTL (NUMBER OF CAG REPEATS), PFGENRI (HTT) and PFGENLOC identifies that the focus of the capillary electrophoresis test is the number of times the first CAG repeat (residing at the position identified in PFGENLOC) is repeated. The prefix "c." in PFGENLOC indicates that base positions are given relative to a coding DNA reference sequence—in this case, LRG_763t1 shown in PFREFSEQ.
In the sequencing analysis records, PFTSTDTL (NUMBER OF GLUTAMINE-PROLINE CODING TRINUCLEOTIDE REPEATS) and PFGENLOC (c.52_153) identifies that the focus of the sequencing test is the HTT glutamine-proline coding trinucleotide repeat region (residing at the position identified in PFGENLOC).
Although investigators typically are primarily concerned with the longest number of pure CAG repeats of the 2 alleles, the results of both alleles are shown and differentiated by PFALLELC.
| Rows 1-2: | Show the results for the number of CAG trinucleotide repeats for each allele from 1 subject as determined by capillary electrophoresis. PFGENLOC (c.52_54) refers to the position of the first CAG trinucleotide relative to a coding DNA reference sequence—in this case, LRG_763t1 shown in PFREFSEQ. |
|---|---|
| Rows 3-4: | Show the results for each allele from the same subject as determined by sequence analysis. This method allows each nucleotide to be read, thereby removing error introduced by non-CAG repeats in the sequence when using electrophoresis of PCR replicons alone. PFGENLOC (c.52_153) identifies that the focus of the sequencing test is the HTT glutamine-proline coding trinucleotide repeat (residing at the position identified in PFGENLOC. Note the difference in result values between Rows 1/3 and 2/4. |
| Rows 5-6: | Show the entire HTT glutamine/proline-coding trinucleotide repeat present in the sequence for each allele. Primers used in the electrophoresis analysis in the first 2 rows would exclude these clinically important repeats. PFGENLOC identifies the position of the start of the CAG repeats through the end of the entire glutamine/proline-coding sequence. |
pf.xpt
| Row | STUDYID | DOMAIN | USUBJID | PFSEQ | PFTESTCD | PFTEST | PFTSTDTL | PFGENTYP | PFGENRI | PFREFSEQ | PFORRES | PFGENLOC | PFSTRESC | PFSTRESN | PFSPEC | PFALLELC | PFMETHOD | VISITNUM | PFDTC |
|---|---|---|---|---|---|---|---|---|---|---|---|---|---|---|---|---|---|---|---|
| 1 | ABC123 | PF | HD01-101 | 1 | MICSATRP | Microsatellite Repeats | NUMBER OF CAG REPEATS | GENE | HTT | LRG_763t1 | 43 | c.52_54 | 43 | 43 | DNA | 1 | CAPILLARY ELECTROPHORESIS | 1 | 2017-05-22 |
| 2 | ABC123 | PF | HD01-101 | 2 | MICSATRP | Microsatellite Repeats | NUMBER OF CAG REPEATS | GENE | HTT | LRG_763t1 | 25 | c.52_54 | 25 | 25 | DNA | 2 | CAPILLARY ELECTROPHORESIS | 1 | 2017-05-22 |
| 3 | ABC123 | PF | HD01-101 | 3 | MICSATRP | Microsatellite Repeats | NUMBER OF CAG REPEATS | GENE | HTT | LRG_763t1 | 44 | c.52_54 | 44 | 44 | DNA | 1 | SEQUENCING | 1 | 2017-05-22 |
| 4 | ABC123 | PF | HD01-101 | 4 | MICSATRP | Microsatellite Repeats | NUMBER OF CAG REPEATS | GENE | HTT | LRG_763t1 | 23 | c.52_54 | 23 | 23 | DNA | 2 | SEQUENCING | 1 | 2017-05-22 |
| 5 | ABC123 | PF | HD01-101 | 5 | MICSATRP | Microsatellite Repeats | NUMBER OF GLUTAMINE-PROLINE CODING TRINUCLEOTIDE REPEATS | GENE | HTT | LRG_763t1 | CAG[44]CAACAG[2]CCGCCA[1]CCG[7]CCT[2] | c.52_153 | CAG[44]CAACAG[2]CCGCCA[1]CCG[7]CCT[2] | DNA | 1 | SEQUENCING | 1 | 2017-05-22 | |
| 6 | ABC123 | PF | HD01-101 | 6 | MICSATRP | Microsatellite Repeats | NUMBER OF GLUTAMINE-PROLINE CODING TRINUCLEOTIDE REPEATS | GENE | HTT | LRG_763t1 | CAG[23]CAACAG[2]CCGCCA[1]CCG[7]CCT[2] | c.52_153 | CAG[23]CAACAG[2]CCGCCA[1]CCG[7]CCT[2] | DNA | 2 | SEQUENCING | 1 | 2017-05-22 |
4 Disease Assessments
Disease assessments are typically done repeatedly over the course of a study and are used to evaluate how a subject is progressing or improving from baseline. For Huntington's disease studies these may include clinical outcomes assessments (questionnaires, ratings and scales), cerebrospinal fluid biomarkers, and imaging biomarkers.
4.1 Questionnaires, Ratings, and Scales
Questionnaires, ratings, and scales (QRSs) are typically done repeatedly over the course of a study and are used to evaluate how a subject is progressing. These are often used to assess the severity of disease and improvement or worsening of specific symptoms.
QRS measures are maintained as standalone guides on the CDISC website at https://www.cdisc.org/foundational/qrs. The following table lists the assessments that have been identified as vital or useful in studies of Huntington's disease (HD). These are either being pursued as potential supplements as part of the development work for the TAUG-HD, or in some cases were already developed. Supplements may or may not be finalized at the time of publication of this TAUG, and depend on copyright approval where applicable. CDISC cannot produce supplements for copyrighted measures without the express permission of the copyright holder. The status listed was up to date as of the publication of this guide, and that status may have changed since publication.
Sponsors should refer to the QRS link above if a measure of interest is not included below, as it may have been developed for another therapeutic area, and new measures are implemented on an ongoing basis by the CDISC QRS Terminology and Standards Development sub-teams. See CDISC COP 001 (http://www.cdisc.org/bylaws-and-policies) for details on implementing or requesting development of standards for SDTM-based submissions.
Table. Measures Relevant to Huntington's Disease Research
| Full Name and Abbreviation | Copyright Permission Status | Supplement Status |
|---|---|---|
| Unified Huntington's Disease Rating Scale (UHDRS) | Granted | Supplement in progress |
| Stroop Color and Word Test | Denied | |
| Letter Fluency - Controlled Oral Word Association Test (COWAT) | Public domain | Supplement in progress |
| Category Fluency | Public domain | In progress |
| Symbol Digit Modalities Test (SDMT)a | Requested | Developed (total score only) |
| Huntington's Disease Cognitive Assessment Battery (HD-CAB) | Granted | In progress |
| Emotion Recognition | Granted | Supplement in progress |
| Hopkins Verbal Learning Test-Revised (HVLT-R) | Requested | |
| One Touch Stockings of Cambridge | Requested | |
| Paced Tapping | Granted | Supplement in progress |
| Symbol Digit Modalities Test (SDMT)a | Requested | Developed (total score only) |
| Trail Making Test, Part B (TMT; both Part A and Part B are covered) | Granted | Done |
| Other Measures of Interest | ||
| Speed Tapping | Public domain | In progress |
| Clinical Global Impression Generic Modification Version (CGI) | Public domain | Supplement in progress |
| Columbia-Suicide Severity Rating Scale (C-SSRS) | Granted | Done |
| Hospital Anxiety and Depression Scale (HADS) | Granted | Done |
| Mini-Mental State Examination (MMSE) | Granted | Supplement in progress |
| Mini-Mental State Examination (MMSE-2 Standard Version) | Granted | Supplement in progress |
| Montreal Cognitive Assessment (MoCA) | Requested | |
| The Short Form 36 Health Survey Standard, US Version 2.0 (SF36 V2.0 Standard) | Requested | |
| Timed Up and Go (TUG) | Public domain | Done |
aSDMT is part of both the UHDRS and the HD-CAB batteries.
4.2 Biofluid Biomarkers
Sampling of cerebrospinal fluid (CSF) and blood has been identified as an important source of potential biomarkers as covariates in Huntington's disease (HD). Some of the biomarkers of interest obtained from these samples include neurofilament light chain (NFL), tau protein (total), and mutant huntingtin protein.[3]This section describes how to represent the data generated throughout the sampling process, from sample collection via lumbar puncture (spinal tap), through the aliquoting and storage of the sample and generation of the results.
It is important to note that several factors of the sample collection methods may affect the results, and therefore should be tightly controlled and recorded. For example, it is possible for tau protein in a biofluid sample to react with the material of the sample collection tube, producing differing results in the downstream processing of the same sample if the sample were to be split into 2 tubes of differing composition. It is not within the purview of this TAUG to dictate to investigators which protocol should be followed in the acquisition of these biomakers. Rather, the sample processing examples included in this guide address this issue from the perspective of showing how to represent the details of these processes as data in SDTM-based datasets. Having these data available as shown below provides analysts with the necessary information to interpret the results in the context of the parameters under which they were acquired. Though the examples focus on CSF sample processing, they are applicable to blood samples as well.
The following concept map shows the provenance of a biomarker value (represented in the Laboratory Test Results [LB] domain) obtained from CSF, starting with the generation of the CSF sample via lumbar puncture and following through the various events the sample may undergo (centrifugation, aliquoting, freezing, thawing) in the process of generating actual endpoints. Each step of the process shows at a high level the different types of data generated that should be represented.
Dashed lines point to the corresponding SDTM domains (or groups of domains, such as those for devices) in which the data generated are represented. Refer to the individual domains referenced in the concept map for a detailed view of how the datasets should be populated using more detailed, realistic example values as endpoints. The red lines indicate steps in the process that may occur in differing order; once collected, samples may be processed immediately, or frozen for processing later.
Concept Map. Biofluid Biomarkers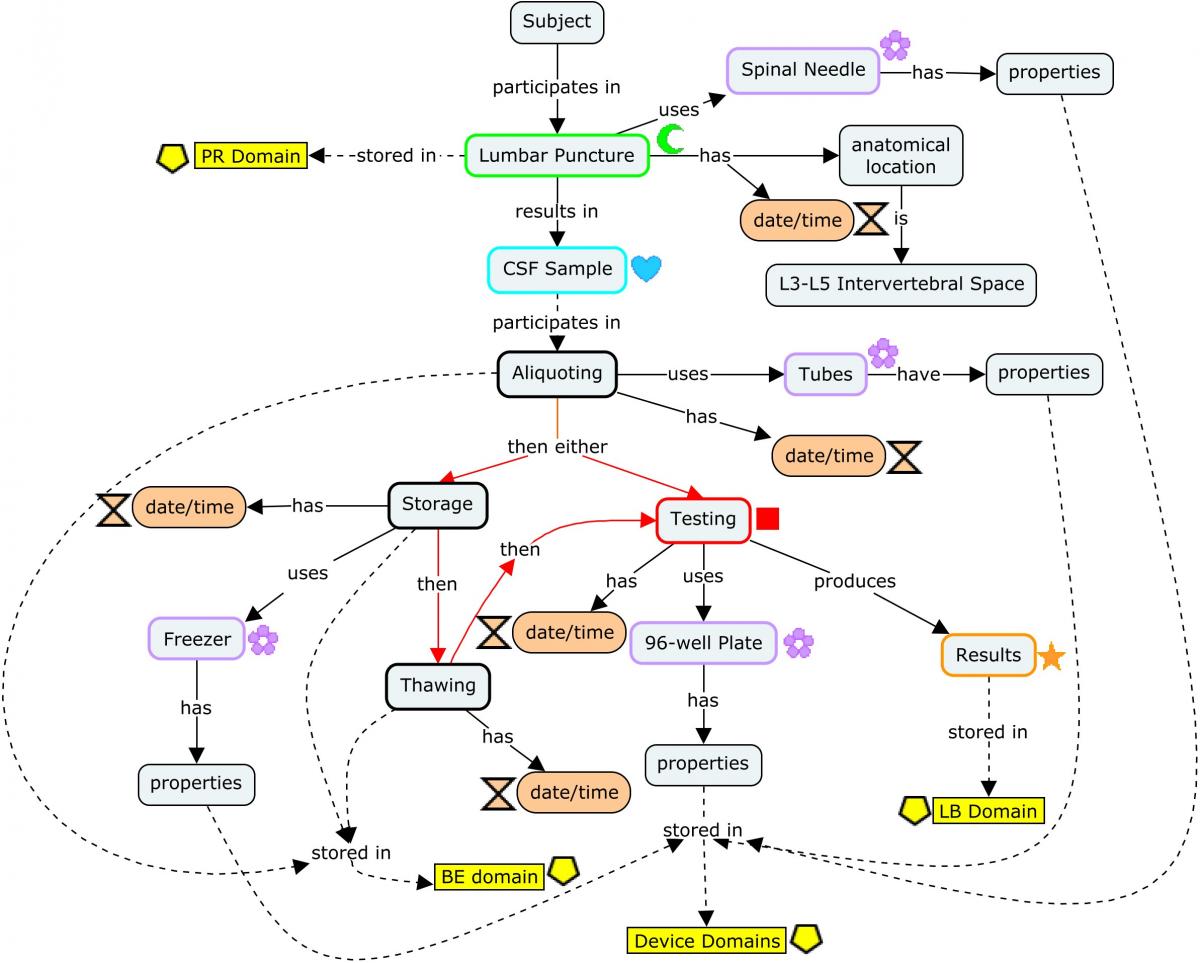
CSF sampling begins with a lumbar puncture, represented in the Procedures (PR) domain. The origin of the CSF sample in the Biospecimen Events (BE) domain is linked to the lumbar puncture via the REFID variable: PRREFID=BEREFID when BETERM=COLLECTING.
From this point, the CSF sample is usually aliquoted. Each aliquot is assigned a PARENT value (in the RELSPEC dataset; Concept Map. Biofluid RELSPEC-RELREC) that corresponds to the REFID value of the collected sample, thus identifying the aliquot as a "child" of that sample. In addition, each aliquot would be assigned a unique REFID value that may be based on the REFID of the parent. For example, if the PRREFID/BEREFID for the sample collection is 100, then BEREFID for the first aliquoting event could be 100.1, and so on. From this point on, all other events and findings using the sample aliquot will be assigned a REFID value in those subsequent domains corresponding to the unique REFID for the aliquot used. In this way, the REFID values can be viewed as a unique sample ID across all observations recorded on that sample in subsequent domains.
The SPDEVID variable is used to identify devices associated with events or findings in other domains. In the PR domain record for Lumbar Puncture, it identifies the spinal needle used to draw the sample. In the biospecimen domains (BE/BS), it identifies the tube lots used to collect/store the sample and aliquots; it may also be used to represent a separate device identifier for a freezer used for storage when freezing is represented in BE. All SPDEVID values also match their respective device identifiers and properties represented in the device domains.
Concept Map. Biofluid RELSPEC-RELREC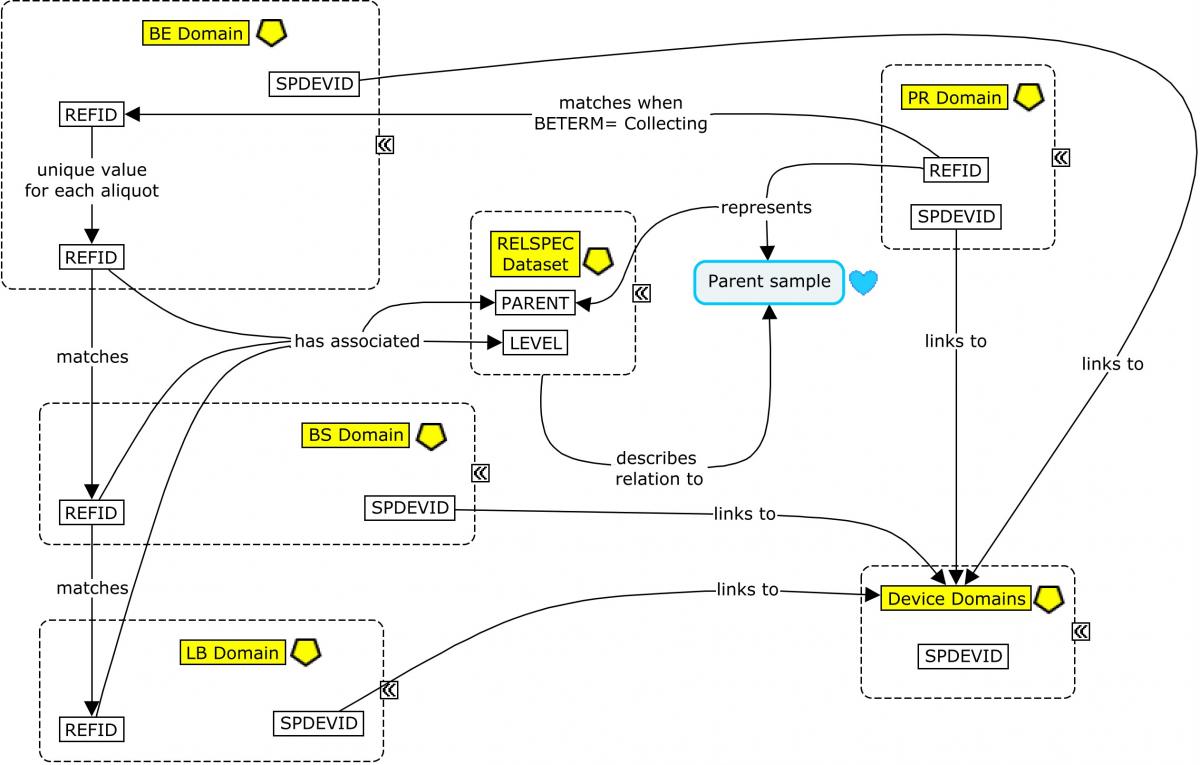
In this section, we show examples of how to represent the various types of data discussed above with the SDTM, and how to relate them to each other and to the biomarker results represented in the LB domain. The examples that follow are intended to illustrate the data modeling of these various properties and findings and are not meant to serve as strict requirements nor as a comprehensive list of the properties and findings which should be provided in a regulatory submission. Sponsors should refer to their regulatory agencies and review divisions for guidance on which data should be included in their submission(s).
Example
This example is organized to reflect the stages of cerebrospinal fluid (CSF) sampling and processing, from collection to results, followed by ancillary device information and dataset relationships.
This example shows the lumbar puncture procedure. The location of the puncture along the spine is noted in PRLOC, and will typically be 1 of the 2 intervertebral spaces between L3-L5. The start and end time are noted also. PRREFID will match BEREFID when BETERM=Collecting. SPDEVID identifies the spinal needle used to extract the sample. The subject was fasting at the time, as indicated by PRFAST=Y.
pr.xpt
| Row | STUDYID | DOMAIN | USUBJID | SPDEVID | PRSEQ | PRREFID | PRTRT | PRLOC | PRFAST | PRSTDTC | PRENDTC |
|---|---|---|---|---|---|---|---|---|---|---|---|
| 1 | ABC123 | PR | HD01-101 | 23290 | 1 | 100 | Lumbar Puncture | L3-L4 INTERVERTEBRAL SPACE | Y | 2017-05-22T08:15 | 2017-05-22T08:50 |
Because the lumbar puncture results in specimen collection, it is also represented in the Biospecimen Event (BE) domain, along with similar information about biospecimen-related events such as aliquoting or freezing.
Each sample needs a separate identifier to link it to further actions or characteristics of the sample. Therefore, each aliquoting event is assigned a unique BEREFID value that can be traced to the BEREFID assigned for the collected "parent" sample. --REFID values are used to connect the BE and Biospecimen Findings (BS) domains, as well as to any results in the Laboratory Test Results (LB) domain obtained from the sample (using BEREFID, BSREFID and LBREFID, respectively).
In this example, 1 aliquot was thawed and returned to the freezer later. That particular aliquot can be traced through to the LB domain, where biomarker test results are represented. For ease of reviewing the example, not all of the detailed rows are shown. Ellipses (...) are used in cells of the table to indicate that Rows 6-19 and 25-38 have been omitted. For example, what would have been Rows 6-19 are represented by 1 row and use the "…" notation. In these rows, only the values for BESEQ and BEREFID change with regard to Row 5.
| Row 1: | Shows the origin of the specimen (BETERM=Collecting). Note that BEREFID=100, which matches the PRREFID in PR.xpt above. |
|---|---|
| Rows 2-20: | Show that the sample was aliquoted. Each separate aliquot is assigned a unique BEREFID. In this case, BEREFID is an incremented decimal value based on the original sample using BEREFID when BETERM=Collecting as a base number. This is not an explicit requirement, but makes tracking the samples easier. The definitive link between parent-child samples is defined in the RELSPEC dataset. SPDEVID refers to the tube storing the aliquot. |
| Rows 21-39: | Show that each aliquot was frozen. BEREFID identifies an individual aliquot. SPDEVID refers to the freezer storing the aliquot. |
| Rows 40-41: | Show an aliquot (BEREFID) that was thawed for analysis then the remainder was re-frozen. Note that the start and end times (BESTDTC, BEENDTC) of the thawing event define the amount of time the sample spent out of the freezer. |
be.xpt
| Row | STUDYID | DOMAIN | USUBJID | SPDEVID | BESEQ | BEREFID | BETERM | BEDTC | BESTDTC | BEENDTC | BESPEC | |
|---|---|---|---|---|---|---|---|---|---|---|---|---|
| 1 | ABC123 | BE | HD01-101 | 23290 | 1 | 100 | Collecting | 2017-05-22 | 2017-05-22T08:15 | 2017-05-22T08:50 | CEREBROSPINAL FLUID | |
| 2 | ABC123 | BE | HD01-101 | 9330 | 2 | 100.1 | Aliquoting | 2017-05-22 | 2017-05-22T09:00 | 2017-05-22T09:10 | CEREBROSPINAL FLUID | |
| 3 | ABC123 | BE | HD01-101 | 9330 | 3 | 100.2 | Aliquoting | 2017-05-22 | 2017-05-22T09:00 | 2017-05-22T09:10 | CEREBROSPINAL FLUID | |
| 4 | ABC123 | BE | HD01-101 | 9330 | 4 | 100.3 | Aliquoting | 2017-05-22 | 2017-05-22T09:00 | 2017-05-22T09:10 | CEREBROSPINAL FLUID | |
| 5 | ABC123 | BE | HD01-101 | 9330 | 5 | 100.4 | Aliquoting | 2017-05-22 | 2017-05-22T09:00 | 2017-05-22T09:10 | CEREBROSPINAL FLUID | |
| … | … | … | … | … | … | … | … | … | … | … | ... | |
| 20 | ABC123 | BE | HD01-101 | 9330 | 20 | 100.19 | Aliquoting | 2017-05-22 | 2017-05-22T09:00 | 2017-05-22T09:10 | CEREBROSPINAL FLUID | |
| 21 | ABC123 | BE | HD01-101 | 31 | 21 | 100.1 | Freezing | 2017-05-22 | 2017-05-22T09:11 | 2017-05-23T08:00 | CEREBROSPINAL FLUID | |
| 22 | ABC123 | BE | HD01-101 | 31 | 22 | 100.2 | Freezing | 2017-05-22 | 2017-05-22T09:11 | 2017-05-23T08:00 | CEREBROSPINAL FLUID | |
| 23 | ABC123 | BE | HD01-101 | 31 | 23 | 100.3 | Freezing | 2017-05-22 | 2017-05-22T09:11 | 2017-05-23T08:00 | CEREBROSPINAL FLUID | |
| 24 | ABC123 | BE | HD01-101 | 31 | 24 | 100.4 | Freezing | 2017-05-22 | 2017-05-22T09:11 | 2017-05-23T08:00 | CEREBROSPINAL FLUID | |
| … | … | … | … | … | … | … | … | … | … | … | ... | |
| 39 | ABC123 | BE | HD01-101 | 31 | 39 | 100.19 | Freezing | 2017-05-22 | 2017-05-22T09:11 | 2017-05-23T08:00 | CEREBROSPINAL FLUID | |
| 40 | ABC123 | BE | HD01-101 | 40 | 100.2 | Thawing | 2017-05-22 | 2017-05-23T08:00 | 2017-05-23T08:18 | CEREBROSPINAL FLUID | ||
| 41 | ABC123 | BE | HD01-101 | 31 | 41 | 100.2 | Freezing | 2017-05-22 | 2017-05-23T08:18 | CEREBROSPINAL FLUID |
BE NSV Metadata
| Variable | Label | Type | Role | Codelist | Origin |
|---|---|---|---|---|---|
| BESPEC | Specimen Type | text | Non-Standard Record Qualifier | SPECTYPE | CRF |
Findings data captured during specimen collection, preparation, and handling are represented in the BS domain.
For ease of use in review, not all of the detailed rows are shown. These rows have ellipses in them. For example, Rows 4-19 are represented by 1 row and use the "…" notation. The omitted rows would be just like Row 3 but for other aliquots, and therefore with different values of BSREFID and BSSEQ.
| Row 1: | Shows the total volume of cerebrospinal fluid collected during the lumbar puncture by using the same values for BSREFID and BEREFID. SPDEVID refers to the tubes used to store the sample. This is the parent (collected) sample from which further aliquots were generated. |
|---|---|
| Rows 2-20: | Show the volume of each aliquot created. SPDEVID refers to the tubes used to store the aliquot. |
| Row 21: | Shows the remaining volume of Aliquot 2 (REFID=100.2) that was thawed, partially used for analysis, and then re-frozen. |
bs.xpt
| Row | STUDYID | DOMAIN | USUBJID | SPDEVID | BSSEQ | BSREFID | BSTESTCD | BSTEST | BSCAT | BSORRES | BSORRESU | BSSTRESC | BSSTRESN | BSSTRESU | BSSPEC | BSDTC |
|---|---|---|---|---|---|---|---|---|---|---|---|---|---|---|---|---|
| 1 | ABC123 | BS | HD01-101 | 8842 | 1 | 100 | VOLUME | Volume | SPECIMEN MEASUREMENT | 20 | mL | 20 | 20 | mL | CEREBROSPINAL FLUID | 2017-05-22 |
| 2 | ABC123 | BS | HD01-101 | 9330 | 2 | 100.1 | VOLUME | Volume | SPECIMEN MEASUREMENT | 2 | mL | 2 | 2 | mL | CEREBROSPINAL FLUID | 2017-05-22 |
| 3 | ABC123 | BS | HD01-101 | 9330 | 3 | 100.2 | VOLUME | Volume | SPECIMEN MEASUREMENT | 1 | mL | 1 | 1 | mL | CEREBROSPINAL FLUID | 2017-05-22 |
| … | … | … | … | … | … | … | … | … | … | … | … | … | … | … | … | … |
| 20 | ABC123 | BS | HD01-101 | 9330 | 20 | 100.19 | VOLUME | Volume | SPECIMEN MEASUREMENT | 1 | mL | 1 | 1 | mL | CEREBROSPINAL FLUID | 2017-05-22 |
| 21 | ABC123 | BS | HD01-101 | 9330 | 21 | 100.2 | VOLUME | Volume | SPECIMEN MEASUREMENT | 0.5 | mL | 0.5 | 0.5 | mL | CEREBROSPINAL FLUID | 2017-05-23 |
The RELSPEC dataset preserves the specimen hierarchy from the collected specimen and the subsequent aliquots.
| Row 1: | Shows the parent (collected) sample from which further aliquots were generated. |
|---|---|
| Rows 2-20: | Show the aliquots generated from the parent sample. PARENT for these records is set equal to the REFID of the parent sample shown in Row 1. LEVEL=2 shows that these samples are second generation samples generated from the parent sample whose specimen level is 1. |
relspec.xpt
| Row | STUDYID | USUBJID | REFID | SPEC | PARENT | LEVEL |
|---|---|---|---|---|---|---|
| 1 | ABC123 | HD01-101 | 100 | CEREBROSPINAL FLUID | 1 | |
| 2 | ABC123 | HD01-101 | 100.1 | CEREBROSPINAL FLUID | 100 | 2 |
| 3 | ABC123 | HD01-101 | 100.2 | CEREBROSPINAL FLUID | 100 | 2 |
| … | … | … | … | … | ||
| 20 | ABC123 | HD01-101 | 100.19 | CEREBROSPINAL FLUID | 100 | 2 |
Results from laboratory tests performed on aliquoted samples are represented in the LB domain. This example shows results for 3 biomarker tests. These results are from the second aliquot of Sample 100, as indicated by the value 100.2 in LBREFID.
lb.xpt
| Row | STUDYID | DOMAIN | USUBJID | SPDEVID | LBSEQ | LBREFID | LBTESTCD | LBTEST | LBORRES | LBORRESU | LBORNRLO | LBORNRHI | LBSTRESC | LBSTRESN | LBSTRESU | LBSPEC | LBMETHOD | LBBLFL | VISITNUM | LBDTC |
|---|---|---|---|---|---|---|---|---|---|---|---|---|---|---|---|---|---|---|---|---|
| 1 | ABC123 | LB | HD01-101 | 3013 | 1 | 100.2 | MHTT | Mutant Huntingtin Protein | 400 | fM | 400 | 400 | fmol/L | CEREBROSPINAL FLUID | IMMUNOPRECIPITATION | Y | 1 | 2017-05-22 | ||
| 2 | ABC123 | LB | HD01-101 | 3013 | 2 | 100.2 | TAU | Tau Protein | 800 | pg/mL | 125 | 400 | 800 | 800 | pg/mL | CEREBROSPINAL FLUID | ELISA | Y | 1 | 2017-05-22 |
| 3 | ABC123 | LB | HD01-101 | 3013 | 3 | 100.2 | NFL | Neurofilament Light Chain | 500 | pmol/L | 1 | 250 | 500 | 500 | pmol/L | CEREBROSPINAL FLUID | ELISA | Y | 1 | 2017-05-22 |
Data about the devices used throughout are represented in the Device Identifier (DI) domain.
| Rows 1-3: | Describe the spinal needle used to extract CSF, the manufacturer, and the lot number of the needle. |
|---|---|
| Rows 4-6: | Describe the tube lot used to collect the entire volume of CSF, and the manufacturer of the tubes. |
| Row 7: | Describes the freezer in which the aliquots were stored. This is important for tracking issues related to potential device failures that may affect results. |
| Rows 8-10: | Describe the tube lot used to store the aliquots created from the entire volume sample, and the manufacturer of the lot. All aliquots used the same tube lot. |
| Rows 11-13: | Describe the 96-well plate used to process the CSF sample, the manufacturer, and the lot number. |
di.xpt
| Row | STUDYID | DOMAIN | SPDEVID | DISEQ | DIPARMCD | DIPARM | DIVAL |
|---|---|---|---|---|---|---|---|
| 1 | ABC123 | DI | 23290 | 1 | DEVTYPE | Device Type | Atraumatic Spinal Needle |
| 2 | ABC123 | DI | 23290 | 2 | MANUF | Manufacturer | Acme |
| 3 | ABC123 | DI | 23290 | 3 | LOT | Lot Number | DPO1028 |
| 4 | ABC123 | DI | 8842 | 1 | DEVTYPE | Device Type | Tube |
| 5 | ABC123 | DI | 8842 | 2 | MANUF | Manufacturer | Acme |
| 6 | ABC123 | DI | 8842 | 3 | LOT | Lot Number | 1200A |
| 7 | ABC123 | DI | 31 | 1 | DEVTYPE | Device Type | Freezer |
| 8 | ABC123 | DI | 9330 | 1 | DEVTYPE | Device Type | Tube |
| 9 | ABC123 | DI | 9330 | 2 | MANUF | Manufacturer | Acme |
| 10 | ABC123 | DI | 9330 | 3 | LOT | Lot Number | 6500A |
| 11 | ABC123 | DI | 3013 | 1 | DEVTYPE | Device Type | 96-well Plate |
| 12 | ABC123 | DI | 3013 | 2 | MANUF | Manufacturer | Advantage Biosciences |
| 13 | ABC123 | DI | 3013 | 3 | LOT | Lot Number | 1qz9193013 |
The fixed properties of a device identified in DI are represented in the Device Properties (DO) domain.
| Row 1: | Shows the size of the needle used in the lumbar puncture. |
|---|---|
| Row 2: | Shows the composition of the tube used to store the aliquots. |
| Row 3: | Shows the temperature of the freezer listed in the DI domain. Note that by storing temperature info in the DO domain, it is indicated that this freezer is a dedicated -80°C freezer. If the freezer had been adjustable, the temperature setting would be listed in the DU domain as per the assumptions of these two domains. |
| Row 4: | Shows that the well plate used in the LB example above was a multiplex probe plate containing 3 unique molecular probes. |
do.xpt
| Row | STUDYID | DOMAIN | SPDEVID | DOSEQ | DOTESTCD | DOTEST | DOORRES | DOORRESU | DOSTRESC | DOSTRESN | DOSTRESU |
|---|---|---|---|---|---|---|---|---|---|---|---|
| 1 | ABC123 | DO | 23290 | 1 | SIZE | Size | 20 | GAUGE | 20 | 20 | NEEDLE GAUGE |
| 2 | ABC123 | DO | 9330 | 1 | COMPOS | Composition | Polypropylene | POLYPROPYLENE | |||
| 3 | ABC123 | DO | 31 | 1 | TEMP | Temperature | -80 | C | -80 | -80 | C |
| 4 | ABC123 | DO | 3013 | 1 | MULTPLEX | Multiplex Probe Parameter | 3 | 3 | 3 |
The RELREC table below shows a number of dataset relationships:
- How an individual CSF sample obtained from the biospecimen collection is related to the lumbar puncture procedure is related to biospecimen collection event for the sample.
- How the multiple biospecimen events in the BE domain are related to the multiple biospecimen properties in the BS domain.
- How an individual biospecimen (aliquot) event is related to multiple laboratory result records.
| Rows 1-2: | Show how to relate records between the procedure and the collection of the sample. This describes that the lumbar procedure with PRREFID=100 is linked to the BE collection event with BEREFID=100. |
|---|---|
| Rows 3-4: | Show the relationship between biospecimen events and biospecimen properties. Note that in the examples above, most records show a one-to-one relationship (e.g., a volume measurement in BS for each event in BE). However, this relationship can—and may often—be a many-to-many relationship. This describes the multiple biospecimen events related to the multiple biospecimen tests that are represented by the RELREC MANY to MANY relationships between the BEREFID and the BSREFID. This relationship is unusual and challenging to manage in a join/merge and only represents the concept of this relationship. To uniquely identify all the BSTESTS related to an individual BETERM, select an individual BEREFID to join/merge with the BSREFID to revise this to a ONE to MANY relationship to obtain all related BSTEST results. |
| Rows 5-6: | Indicate the link between the biospecimen (aliquot) and the lab result. A unique BEREFID for each aliquot is linked with the same LBREFID value to obtain all the LB results related to the individual aliquot. This describes the multiple biospecimen events related to the multiple lab tests that are represented by the RELREC MANY to MANY relationships between the BEREFID and the LBREFID. This relationship is unusual and challenging to manage in a join/merge and only represents the concept of this relationship. To uniquely identify all the LBTESTs related to an individual BETERM, select an individual BEREFID to join/merge with the LBREFID to revise this to a ONE to MANY relationship to obtain all related LBTEST results. |
relrec.xpt
| Row | STUDYID | RDOMAIN | USUBJID | IDVAR | IDVARVAL | RELTYPE | RELID |
|---|---|---|---|---|---|---|---|
| 1 | ABC123 | PR | PRREFID | ONE | 1 | ||
| 2 | ABC123 | BE | BEREFID | ONE | 1 | ||
| 3 | ABC123 | BE | BEREFID | MANY | 2 | ||
| 4 | ABC123 | BS | BSREFID | MANY | 2 | ||
| 5 | ABC123 | BE | BEREFID | MANY | 3 | ||
| 6 | ABC123 | LB | LBREFID | MANY | 3 |
The following table lists other examples of biomarkers that may be used in HD clinical trials, for which CDISC Controlled Terminology is either published or proposed. Regardless of the analyte (biomarker) and specimen type, the data would be handled the same as shown in the preceding examples. Users should always refer to the most recently published controlled terminology before implementing the terms with a status of "requested" shown below.
Biomarkers for Use in Huntington's Disease Clinical Trials
| LBTEST | LBTESTCD | LBSPEC | Controlled Terminology Status1 |
|---|---|---|---|
| Huntingtin Protein | HTT | CEREBROSPINAL FLUID | Requested |
| Mutant Huntingtin Protein | MHTT | CEREBROSPINAL FLUID | Requested |
| Alpha Synuclein | ASYN | CEREBROSPINAL FLUID | Requested |
| Neurofilament Light Chain | NFL | CEREBROSPINAL FLUID or BLOOD | Requested |
| Tau Protein | TPROT | CEREBROSPINAL FLUID | Published |
| Phosphorylated Tau Protein | TPROTP | CEREBROSPINAL FLUID | Published |
| Amyloid Beta 1-42 | AMYLB42 | CEREBROSPINAL FLUID | Published |
| Interleukin 6 | INTLK6 | CEREBROSPINAL FLUID | Published |
| Interleukin 8 | INTLK8 | CEREBROSPINAL FLUID | Published |
| YKL-40 Protein | YKL40 | CEREBROSPINAL FLUID | Requested |
| Cocaine and Amphetamine-Reg Transcr Prot | CARTPROT | CEREBROSPINAL FLUID | Requested |
| Ubiquitin | UBQN | CEREBROSPINAL FLUID | Requested |
1Refers to the values in the LBTEST and LBTESTCD columns. Values in the LBSPEC column already exist as controlled terminology.
4.3 Imaging
Magnetic resonance imaging (MRI) and positron emission tomography (PET) or positron emission tomography/computerized tomography (PET/CT) are valuable tools for assessing imaging biomarkers in Huntington's disease (HD). In more recent years, magnetic resonance spectroscopy (MRS) has emerged as a potentially useful research tool in HD as well. The following subsections describe these procedures at a high level, with an emphasis on the data that are generated and how they should be represented in SDTM-based datasets.
4.3.1 Magnetic Resonance Imaging (MRI)
In Huntington's disease (HD), magnetic resonance imaging (MRI) is primarily used for obtaining volumetric brain measurements, as evidence suggests these biomarkers correlate with disease progression.[4] HD is characterized pathologically by selective neurodegeneration of specific brain regions. Neuroimaging measures associated with HD signs and symptoms are tightly associated with clinical outcomes and can precede onset of motor symptoms. Selective neurodegeneration of medium spiny neurons (MSNs) results in measurable atrophy in the striatum (composed of the caudate and putamen). Putamen volume is related to the number of MSNs and correlates with motor impairment in HD. Neuroanatomic regions of interest include:
- Basal ganglia: Collective term referring to clusters of neurons (caudate nucleus, putamen, and globus pallidus) that are responsible for involuntary movements such as tremors, and chorea.
- Striatum: Term that describes a collection of nuclei that mediate the refinement and control of motor movement; regions of the brain that comprise the striatum include caudate, putamen, and nucleus accumbens.
In a brain MRI procedure, the subject lies down and is entered into the MRI scanner. Once the subject is in the scanner, the procedure begins by collecting a series of image slices across the region of interest (in this case, the head). Multiple sets of image slices—commonly referred to as scans—are typically collected across the entire volume of the head, with each new set (scan) potentially using different properties than the scan before. This is important to note: The changing properties between each scan may affect how that image series can be used or interpreted, and is usually controlled by protocol and/or recorded for later reference by analysts. To reiterate: A single MRI procedure (which would be represented in the Procedures [PR] domain) results in multiple scans, each differentiated by the set of properties that were in place for that scan. These changeable settings that may vary from one scan to the next are represented in the Device In-Use (DU) domain. Examples include, but are not limited to, properties such as image weighting, matrix size, slice thickness, repetition time (TR), echo time (TE), inversion time (TI), and anatomical plane of image acquisition. These parameters are usually represented in standardized reports such as the DICOM header.
In addition, MRI scanners have inherent onboard properties which generally would not change in the course of a study. These unchanging properties are represented in the Device Properties (DO) domain. Finally, information such as make, model, and serial number would be represented in the Device Identifiers (DI) domain.
This section provides examples of how to represent these types of data in SDTM-based datasets and how to relate them to each other and to the volumetric findings represented in the Nervous System Findings (NV) domain. The examples are only intended to illustrate the data modeling of these various properties and findings, and are not meant to serve as strict requirements nor as a comprehensive list of the properties and findings which should be provided in a regulatory submission. Sponsors should seek guidance from their regulatory agencies and review divisions regarding which data should be recorded and submitted as appropriate for their individual studies.
The following concept map shows the provenance of a brain morphological measurement starting with the generation of the images via MRI and following through to the derivation of the endpoint. Each step of the process shows at a high level the different types of data that are generated and how they should be represented.
For ease of reading, only the salient concepts are shown. Refer to the individual domain examples referenced in the concept map below for a detailed view of how the datasets should be populated.
Concept Map. MRI Imaging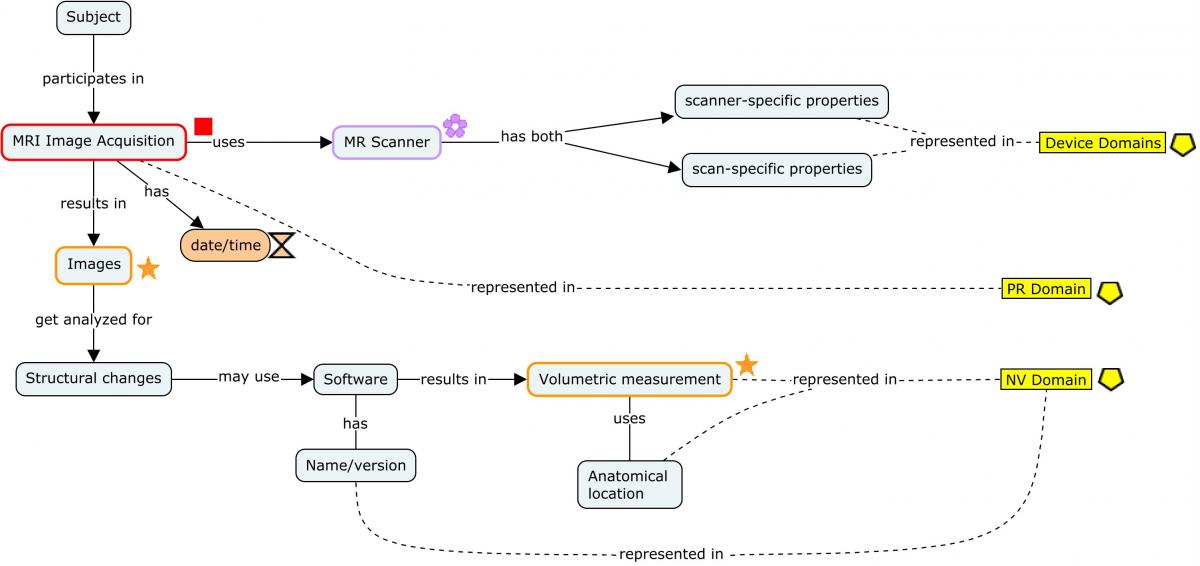
The MRI imaging procedure is represented in the PR domain. During this procedure, multiple scans may be conducted. Each scan is identified by a unique set of properties that apply to the scan, and those properties are grouped in the Device In-Use (DU) domain by DUREFID. The link between the findings and the individual scan from which they are derived is maintained by having PRREFID=NVREFID=DUREFID. This allows for linking the findings to a unique scan and its associated parameters within the procedure and the results. When multiple scans are conducted for a single imaging procedure each scan will have a unique PRREFID, but each overall procedure will have a unique PRLINKID. In all cases below, SPDEVID refers to the unique identifier for the MRI scanner.
Note that if a contrast agent was used, it would be placed in the Procedure Agents (AG) domain according to the PET imaging example provided in Section 4.3.3, Positron Emission Tomography (PET).
Concept Map. Relating Records in MRI Imaging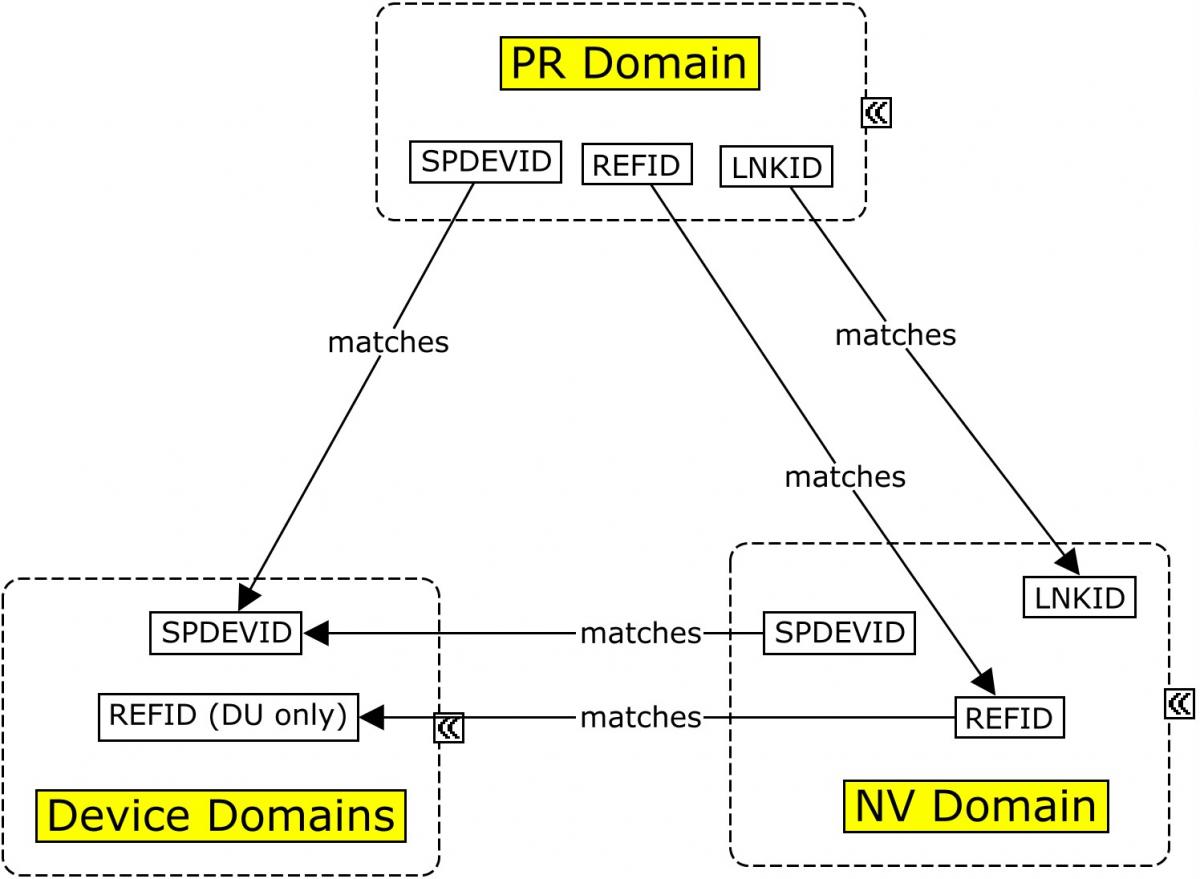
Example
This example illustrates the modeling of various pieces of information collected and generated from the MRI procedure through the determination of the volumetric results, using the Procedures (PR), Nervous System Findings (NV), Device Identifier (DI), Device In-Use (DU), and Device Properties (DO) domains. As shown in Concept Map. Relating Records in MRI Imaging, both --LNKID and --REFID have been used to allow NV to be related to 2 disparate datasets.
The occurrence of an MRI procedure is represented in the PR domain. In this example of an MRI of the head for a subject, the sponsor chose to represent 1 record for the overall MRI procedure in the first row. The subsequent rows show 2 specific scans done within this overall procedure. All 3 records are grouped using PRGRPID. The PRREFID values for these scans match the same value of DUREFID in the DU data, where the scans' varying acquisition parameters are represented. PRLNKID links the procedure to the findings in NV via NVLNKID.
pr.xpt
| Row | STUDYID | DOMAIN | USUBJID | SPDEVID | PRSEQ | PFGRPID | PRREFID | PRLNKID | PRTRT | PRDECOD | PRLOC | PRFAST | PRSTDTC | PRENDTC |
|---|---|---|---|---|---|---|---|---|---|---|---|---|---|---|
| 1 | ABC123 | PR | HD01-101 | 16 | 1 | 1 | 02 | MRI | MAGNETIC RESONANCE IMAGING | HEAD | Y | 2017-05-22T12:10 | 2017-05-22T12:50 | |
| 2 | ABC123 | PR | HD01-101 | 16 | 2 | 1 | 1234 | 02 | Sagittal SPGR Scan | HEAD | Y | 2017-05-22T12:10 | 2017-05-22T12:30 | |
| 3 | ABC123 | PR | HD01-101 | 16 | 3 | 1 | 1235 | 02 | Transverse SPGR Scan | HEAD | Y | 2017-05-22T12:30 | 2017-05-22T12:50 |
Volumetric endpoints derived from scans during an MRI procedure are represented in the NV domain. In this example, NVMETHOD indicates that contrast enhancement was not used. If contrast enhancement had been used, NVMETHOD would have been set to "CONTRAST ENHANCED MRI" in accordance with controlled terminology. NVDTC matches the date of the MRI procedure from which these results were obtained. NVLNKID matches the PRLNKID for the MRI procedure. Note the use of NVREFID, which matches the value of DUREFID, which in turn identifies the specific scan from which these findings were determined. (See Concept Map. Relating Records in MRI Imaging and the DU example which follows for more details.) The MRI device is represented in SPDEVID, whereas the analysis software used is represented in NVANMETH.
| Rows 1-5: | NVREFID=1234, which matches DUREFID=1234. This identifies that the volumes of the brain regions shown in these records were determined using the specific scan as identified by this value of DUREFID (see DU example for more details). |
|---|---|
| Rows 6-8: | NVREFID=1235, which matches DUREFID=1235. This identifies that the volumes of the brain regions shown in these records were determined using the specific scan as identified by this value of DUREFID (see DU example for more details). |
nv.xpt
| Row | STUDYID | DOMAIN | USUBJID | SPDEVID | NVSEQ | NVLNKID | NVREFID | NVTESTCD | NVTEST | NVORRES | NVORRESU | NVSTRESC | NVSTRESN | NVSTRESU | NVLOC | NVLAT | NVMETHOD | NVANMETH | NVDTC |
|---|---|---|---|---|---|---|---|---|---|---|---|---|---|---|---|---|---|---|---|
| 1 | ABC123 | NV | HD01-101 | 16 | 1 | 02 | 1234 | VOLUME | Volume | 3.64 | mL | 3.64 | 3.64 | mL | GLOBUS PALLIDUS | MRI WITHOUT CONTRAST | NEUROQUANT 12.1 | 2017-05-22 | |
| 2 | ABC123 | NV | HD01-101 | 16 | 2 | 02 | 1234 | VOLUME | Volume | 9.10 | mL | 9.10 | 9.10 | mL | PUTAMEN | LEFT | MRI WITHOUT CONTRAST | NEUROQUANT 12.1 | 2017-05-22 |
| 3 | ABC123 | NV | HD01-101 | 16 | 3 | 02 | 1234 | VOLUME | Volume | 9.21 | mL | 9.21 | 9.21 | mL | PUTAMEN | RIGHT | MRI WITHOUT CONTRAST | NEUROQUANT 12.1 | 2017-05-22 |
| 4 | ABC123 | NV | HD01-101 | 16 | 4 | 02 | 1234 | VOLUME | Volume | 7.89 | mL | 7.89 | 7.89 | mL | CAUDATE NUCLEUS | LEFT | MRI WITHOUT CONTRAST | NEUROQUANT 12.1 | 2017-05-22 |
| 5 | ABC123 | NV | HD01-101 | 16 | 5 | 02 | 1234 | VOLUME | Volume | 7.76 | mL | 7.76 | 7.76 | mL | CAUDATE NUCLEUS | RIGHT | MRI WITHOUT CONTRAST | NEUROQUANT 12.1 | 2017-05-22 |
| 6 | ABC123 | NV | HD01-101 | 16 | 6 | 02 | 1235 | VOLUME | Volume | 17.11 | mL | 17.11 | 17.11 | mL | STRIATUM | MRI WITHOUT CONTRAST | NEUROQUANT 12.1 | 2017-05-22 | |
| 7 | ABC123 | NV | HD01-101 | 16 | 7 | 02 | 1235 | VOLUME | Volume | 20.09 | mL | 20.09 | 20.09 | mL | BASAL GANGLIA | MRI WITHOUT CONTRAST | NEUROQUANT 12.1 | 2017-05-22 | |
| 8 | ABC123 | NV | HD01-101 | 16 | 8 | 02 | 1235 | VOLUME | Volume | 864 | mL | 864 | 864 | mL | BRAIN | MRI WITHOUT CONTRAST | NEUROQUANT 12.1 | 2017-05-22 |
The MRI imaging device, the manufacturer, and the model are represented in the DI domain. Because SPDEVID is included as a variable in the other datasets, RELREC is not needed to relate DI to other domains.
di.xpt
| Row | STUDYID | DOMAIN | SPDEVID | DISEQ | DIPARMCD | DIPARM | DIVAL |
|---|---|---|---|---|---|---|---|
| 1 | ABC123 | DI | 16 | 1 | DEVTYPE | Device Type | MRI |
| 2 | ABC123 | DI | 16 | 2 | MANUF | Manufacturer | Acme |
| 3 | ABC123 | DI | 16 | 3 | MODEL | Model | Alpha |
Changeable properties and parameters for devices identified in DI are represented in the DU domain. This example shows how to represent various properties of the MRI device that may change between scans. DUREFID indicates a unique scan, as defined by a changeable set of properties that were set as indicated for each scan. This value is shared by the value of PRREFID as well as NVREFID for any findings or conclusions made from this scan. Note that the properties in this example are meant to serve as examples only of properties that could appear in a DICOM header. Sponsors should refer to regulatory guidance and speak to their individual review division(s) to determine which parameters should be included in the data submission, and then verify if controlled terminology exists for these parameters.
| Rows 1-16: | This particular scan was conducted in the sagittal plane, using the MRI scanner represented by SPDEVID=16. |
|---|---|
| Rows 17-32: | This particular scan was conducted in the transverse plane. This represents the second scan conducted on the same subject during the same imaging procedure that started with the scan depicted in Rows 1-16. The only property that has changed for this scan from the previous scan is represented in DUTEST=Anatomical Plane. |
du.xpt
| Row | STUDYID | DOMAIN | USUBJID | SPDEVID | DUSEQ | DUREFID | DUTESTCD | DUTEST | DUORRES | DUORRESU | ... | VISITNUM | DUDTC |
|---|---|---|---|---|---|---|---|---|---|---|---|---|---|
| 1 | ABC123 | DU | HD01-101 | 16 | 1 | 1234 | ANTPLANE | Anatomical Plane | SAGITTAL | ... | 1 | 2017-05-22T12:30 | |
| 2 | ABC123 | DU | HD01-101 | 16 | 2 | 1234 | PULSSEQ | Pulse Sequence | SPGR | ... | 1 | 2017-05-22T12:30 | |
| 3 | ABC123 | DU | HD01-101 | 16 | 3 | 1234 | STHICK | Slice Thickness | 4 | mm | ... | 1 | 2017-05-22T12:30 |
| 4 | ABC123 | DU | HD01-101 | 16 | 4 | 1234 | AQMTRXSZ | Image Acquisition Matrix Size | 256X256 | VOXEL | ... | 1 | 2017-05-22T12:30 |
| 5 | ABC123 | DU | HD01-101 | 16 | 5 | 1234 | IMWGTTYP | Image Weighting Type | T1 | ... | 1 | 2017-05-22T12:30 | |
| 6 | ABC123 | DU | HD01-101 | 16 | 6 | 1234 | INTDISTM | Interslice Distance | 1 | mm | ... | 1 | 2017-05-22T12:30 |
| 7 | ABC123 | DU | HD01-101 | 16 | 7 | 1234 | FLDVIEW | Field of View | 280X280 | mm | ... | 1 | 2017-05-22T12:30 |
| 8 | ABC123 | DU | HD01-101 | 16 | 8 | 1234 | FLIPANGL | Flip Angle | 8 | deg | ... | 1 | 2017-05-22T12:30 |
| 9 | ABC123 | DU | HD01-101 | 16 | 9 | 1234 | PIXSPCX | X-axis Pixel Spacing | 1.25 | mm | ... | 1 | 2017-05-22T12:30 |
| 10 | ABC123 | DU | HD01-101 | 16 | 10 | 1234 | PIXSPCY | Y-axis Pixel Spacing | 1.25 | mm | ... | 1 | 2017-05-22T12:30 |
| 11 | ABC123 | DU | HD01-101 | 16 | 11 | 1234 | INVRTIME | Inversion Time | 1000 | msec | ... | 1 | 2017-05-22T12:30 |
| 12 | ABC123 | DU | HD01-101 | 16 | 12 | 1234 | ECHOTIME | Echo Time | 3.59 | msec | ... | 1 | 2017-05-22T12:30 |
| 13 | ABC123 | DU | HD01-101 | 16 | 13 | 1234 | REPTIME | Repetition Time | 3000 | msec | ... | 1 | 2017-05-22T12:30 |
| 14 | ABC123 | DU | HD01-101 | 16 | 14 | 1234 | NUMSLICE | Number of Slices | 125 | ... | 1 | 2017-05-22T12:30 | |
| 15 | ABC123 | DU | HD01-101 | 16 | 15 | 1234 | IMAQDIM | Image Acquisition Dimensionality | 3D | ... | 1 | 2017-05-22T12:30 | |
| 16 | ABC123 | DU | HD01-101 | 16 | 16 | 1234 | COILSTR | Coil Strength | 1.5 | T | ... | 1 | 2017-05-22T12:30 |
| 17 | ABC123 | DU | HD01-101 | 16 | 17 | 1235 | ANTPLANE | Anatomical Plane | TRANSVERSE | ... | 1 | 2017-05-22T12:50 | |
| 18 | ABC123 | DU | HD01-101 | 16 | 18 | 1235 | PULSSEQ | Pulse Sequence | SPGR | ... | 1 | 2017-05-22T12:50 | |
| 19 | ABC123 | DU | HD01-101 | 16 | 19 | 1235 | STHICK | Slice Thickness | 4 | mm | ... | 1 | 2017-05-22T12:50 |
| 20 | ABC123 | DU | HD01-101 | 16 | 20 | 1235 | AQMTRXSZ | Image Acquisition Matrix Size | 256X256 | VOXEL | ... | 1 | 2017-05-22T12:50 |
| 21 | ABC123 | DU | HD01-101 | 16 | 21 | 1235 | IMWGTTYP | Image Weighting Type | T1 | ... | 1 | 2017-05-22T12:50 | |
| 22 | ABC123 | DU | HD01-101 | 16 | 22 | 1235 | INTDISTM | Interslice Distance | 1 | mm | ... | 1 | 2017-05-22T12:50 |
| 23 | ABC123 | DU | HD01-101 | 16 | 23 | 1235 | FLDVIEW | Field of View | 280X280 | mm | ... | 1 | 2017-05-22T12:50 |
| 24 | ABC123 | DU | HD01-101 | 16 | 24 | 1235 | FLIPANGL | Flip Angle | 8 | deg | ... | 1 | 2017-05-22T12:50 |
| 25 | ABC123 | DU | HD01-101 | 16 | 25 | 1235 | PIXSPCX | X-axis Pixel Spacing | 1.25 | mm | ... | 1 | 2017-05-22T12:50 |
| 26 | ABC123 | DU | HD01-101 | 16 | 26 | 1235 | PIXSPCY | Y-axis Pixel Spacing | 1.25 | mm | ... | 1 | 2017-05-22T12:50 |
| 27 | ABC123 | DU | HD01-101 | 16 | 27 | 1235 | INVRTIME | Inversion Time | 1000 | msec | ... | 1 | 2017-05-22T12:50 |
| 28 | ABC123 | DU | HD01-101 | 16 | 28 | 1235 | ECHOTIME | Echo Time | 3.59 | msec | ... | 1 | 2017-05-22T12:50 |
| 29 | ABC123 | DU | HD01-101 | 16 | 29 | 1235 | REPTIME | Repetition Time | 3000 | msec | ... | 1 | 2017-05-22T12:50 |
| 30 | ABC123 | DU | HD01-101 | 16 | 30 | 1235 | NUMSLICE | Number of Slices | 125 | ... | 1 | 2017-05-22T12:50 | |
| 31 | ABC123 | DU | HD01-101 | 16 | 31 | 1235 | IMAQDIM | Image Acquisition Dimensionality | 3D | ... | 1 | 2017-05-22T12:50 | |
| 32 | ABC123 | DU | HD01-101 | 16 | 32 | 1235 | COILSTR | Coil Strength | 1.5 | T | ... | 1 | 2017-05-22T12:50 |
Fixed properties for the MRI scanner used are represented in the DO domain.
Note that in the do.xpt example below, "Software Version" is represented as a value for DOTEST, whereas in the nv.xpt example above, software name and version number are represented as a concatenated concept in NVANMETH. The software shown in DO below refers to the on-board software running on the imaging device/scanner (i.e., a device property). The software programs used to aid the neuroimaging expert in arriving at results in the NV example refer to post-processing analyses (occurring after the images have been exported from the scanner); thus, they are not properties of the scanner itself.
do.xpt
| Row | STUDYID | DOMAIN | SPDEVID | DOSEQ | DOTESTCD | DOTEST | DOORRES | DOORRESU |
|---|---|---|---|---|---|---|---|---|
| 1 | ABC123 | DO | 16 | 1 | MRICTYPE | MRI Coil Type | Head | |
| 2 | ABC123 | DO | 16 | 2 | SFTWRVER | Software Version | 3.1 |
The relationship between the MRI scan and the results, and the relationship between the results and the settings of the MRI device, are represented in RELREC.
| Rows 1-2: | Link the nervous system result to the particular procedure performed. This indicates that the PRLNKID variable for an individual procedure is linked to multiple NV records via the same value in the NVLNKID variable. |
|---|---|
| Rows 3-5: | Link the nervous system result to the particular scan and properties/settings of the scanner. This describes the multiple scans represented in PR related to the multiple NV results and multiple DUTESTs that are represented by the RELREC MANY to MANY relationships between the PRREFID, NVREFID and the DUREFID. |
relrec.xpt
| Row | STUDYID | RDOMAIN | USUBJID | IDVAR | IDVARVAL | RELTYPE | RELID |
|---|---|---|---|---|---|---|---|
| 1 | ABC123 | PR | PRLNKID | MANY | 5 | ||
| 2 | ABC123 | NV | NVLNKID | MANY | 5 | ||
| 3 | ABC123 | PR | PRREFID | MANY | 4 | ||
| 4 | ABC123 | NV | NVREFID | MANY | 4 | ||
| 5 | ABC123 | DU | DUREFID | MANY | 4 |
4.3.2 Magnetic Resonance Spectroscopy (MRS)
In Huntington's disease (HD), magnetic resonance spectroscopy (MRS) procedures use a magnetic resonance imaging (MRI) scanner to obtain spectroscopy data for the purposes of tracking changes in concentrations of metabolites present in brain tissue over time. Some of these changes correlate with disease progression. MRS scans do not produce anatomical (image) data; rather, they produce spectra. Investigators look for peaks whose position and total area on the graph correspond to the presence of specific molecules and their concentrations, respectively. Obtaining meaningful spectroscopy data does, however, require image data in order to localize the source of these spectra to specific regions of the brain that can only be chosen from anatomical images. Therefore, an anatomical scan is first conducted on the subject. If the resulting 3-D images are of sufficient quality, the investigator will manually select a voxel in a region of interest and immediately run a subsequent MRS scan to obtain spectroscopy data from that voxel while the subject is still in position. Both scans—the anatomical image acquisition and the subsequent spectroscopy data acquisition—use the same MR scanning device running a different set of acquisition parameters relevant to the different types of data they are intended to acquire.
This section provides examples of how to represent types of data generated through MRS procedures (more specifically, single-voxel selection MRS) in SDTM datasets, and how to relate them to each other and to the metabolite concentration findings. No details about the anatomical MRI scan are provided here; for examples, see Section 4.3.1, Magnetic Resonance Imaging (MRI).
The examples provided here are only intended to illustrate the data modeling of these various properties and findings and are not meant to serve as strict requirements for data submissions nor as a comprehensive list of the properties and findings which should be provided in a regulatory submission. Study sponsors should seek guidance from their regulatory agencies and review divisions, as applicable, regarding which of these data should be recorded and submitted as appropriate for their individual studies.
The concept map below provides an overview of MRS, from data acquisition to the metabolite results. Each step of the process shows at a high level the different types of data that are generated and where they are represented in SDTM. Note that although both the scans use the same device, the parameters used for each scan differ (e.g., water suppression methods apply to MRS scans, not imaging scans).
For ease of reading, only a few salient concepts are shown. Refer to the individual domain examples referenced in the concept map for more details on the types of data that would be represented in those domains.
Concept Map. Magnetic Resonance Spectroscopy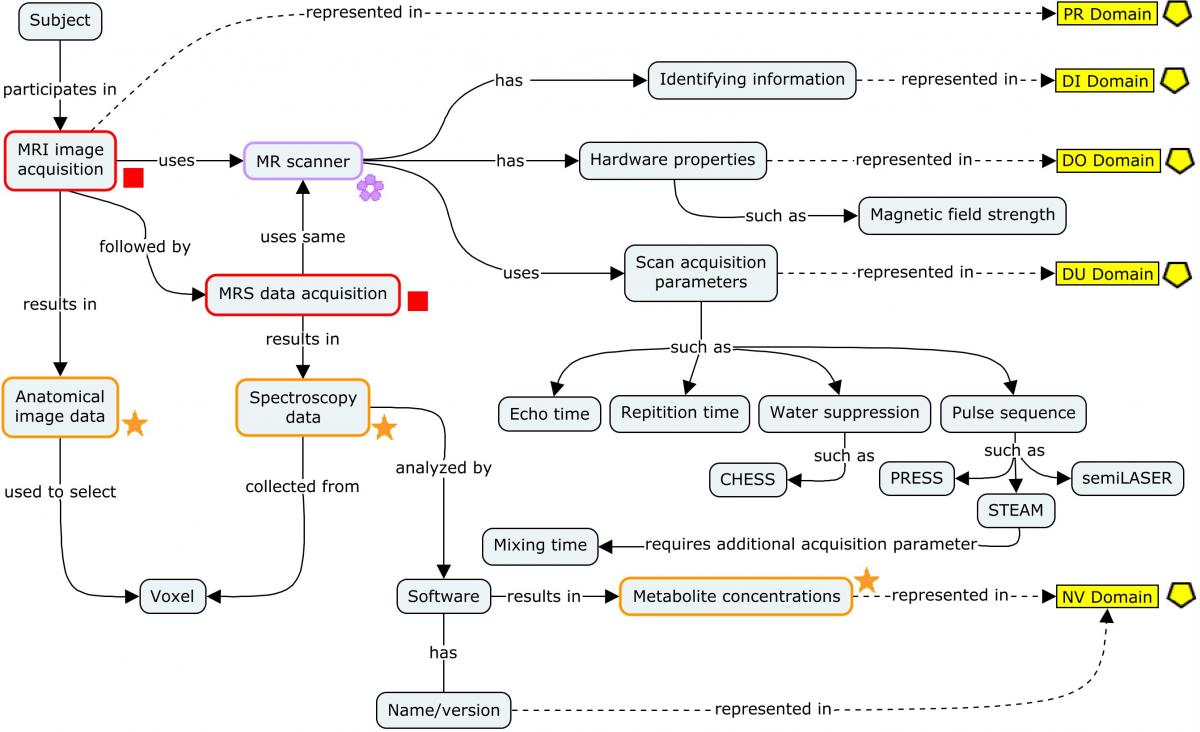
Example
This example illustrates the modeling of various pieces of information collected and generated from a single voxel magnetic resonance spectroscopy (MRS) procedure, using the Procedures (PR), Nervous System Findings (NV), Device Identifier (DI), Device In-Use (DU), and Device Properties (DO) domains. In the same manner shown in Concept Map. Relating Records in MRI Imaging, both --LNKID and --REFID have been used to allow NV to be related to 2 disparate datasets.
The occurrence of an MRS procedure is represented in the PR domain. In this example of an MRS of the head for a subject, the sponsor chose to create 3 records: 1 for the overall procedure and 1 for each of its components (the anatomical scan and the spectroscopy scan). Recording start and end times of each component scan enables calculation of the total time elapsed between the 2 scans. This elapsed time may serve as an indicator of the quality of the spectroscopy data because it indicates the length of time the subject had to lie still while the technician selected the voxel for the spectroscopy scan.
PRLNKID links the procedure to the findings in NV via NVLNKID. Note that the subject was fasting during this procedure. Note that all records share the same value of PRREFID. This serves as a link to the scan parameters represented in the device domain, and has previously been used to represent the parameters of a unique scan when more than 1 scan is performed in an imaging provedure. Because some of these parameters pertain to both component scans of the parent scan in the first row, the sponsor chose to represent them under the same value of PRREFID.
| Row 1: | Shows an overall record of the MRS scan. |
|---|---|
| Row 2: | Shows the first of 2 component scans was the anatomical scan, which decodes to MAGNETIC RESONANCE IMAGING |
| Row 3: | Shows the second scan was the spectroscopy scan, which decodes to MAGNETIC RESONANCE SPECTROSCOPY, same as in Row 1 above. Also note that the time elapsed between the end of the anatomical scan and the start of this scan was 90 seconds. |
pr.xpt
| Row | STUDYID | DOMAIN | USUBJID | SPDEVID | PRSEQ | PRREFID | PRLNKID | PRTRT | PRDECOD | PRLOC | PRFAST | PRSTDTC | PRENDTC |
|---|---|---|---|---|---|---|---|---|---|---|---|---|---|
| 1 | ABC123 | PR | HD01-101 | 21 | 1 | 2345 | 02 | MRS | MAGNETIC RESONANCE SPECTROSCOPY | HEAD | Y | 2017-05-22T12:10:00 | 2017-05-22T12:51:30 |
| 2 | ABC123 | PR | HD01-101 | 21 | 2 | 2345 | 02 | Anatomical Scan | MAGNETIC RESONANCE IMAGING | HEAD | Y | 2017-05-22T12:10:00 | 2017-05-22T12:30:00 |
| 3 | ABC123 | PR | HD01-101 | 21 | 3 | 2345 | 02 | Spectroscopy Scan | MAGNETIC RESONANCE SPECTROSCOPY | HEAD | Y | 2017-05-22T12:31:30 | 2017-05-22T12:51:30 |
The following example shows 6 metabolite concentrations as determined by MRS. NVDTC matches the date of the MRS procedure from which these results were obtained. NVLNKID matches the PRLNKID for the MRS procedure. Note the use of NVREFID, which matches the value of DUREFID, which in turn identifies the specific scan from which these findings were determined (see Concept Map. Relating Records in MRI Imaging and the DU example in that section for more details). Each record of a metabolite concentration also contains 3 NSVs showing (1) the Signal to Noise Ratio (SNR), (2) the Relative Cramer-Rao Lower Bound (RCRLB) for that value, and (3) the units associated with RCRLB (RCRLBU). CRLB is a statistic representing the lower bound on the variance of an unbiased estimator. Here this statistic is expressed as a percentage, thus relative CRLB.
The NSV "SNR" (Signal to Noise Ratio) is shown as a qualifier of results in the NSV table below the following example. In fact, SNR qualifies the entire spectroscopy dataset from which these individual results were obtained. There is currently no good way to represent qualifiers of data at this level; thus, the SNR value for the dataset is replicated on the individual results/records. This is also listed in Section 1.3, Known Issues.
The still-provisional NSV approach utilized by this and recent TAUGs simplifies reviewability of the documents by displaying NSVs as if they were additional columns. As long as this NSV approach is provisional, additional variables sponsors are including for submission are required to be represented in supplemental qualifier datasets (supp--.xpt). In both scenarios, when one variable qualifies another (as in the case where --RCRLBU qualifies --RCRLB, below) sponsors should provide the role the non-standard variables play (in the data) in the define.xml (as shown in the NSV metadata table below the following example).
nv.xpt
| Row | STUDYID | DOMAIN | USUBJID | SPDEVID | NVSEQ | NVLNKID | NVREFID | NVTESTCD | NVTEST | NVORRES | NVORRESU | NVSTRESC | NVSTRESN | NVSTRESU | NVLOC | NVLAT | NVMETHOD | NVANMETH | NVDTC | NVSNR | NVRCRLB | NVRCRLBU | |
|---|---|---|---|---|---|---|---|---|---|---|---|---|---|---|---|---|---|---|---|---|---|---|---|
| 1 | ABC123 | NV | HD01-101 | 21 | 1 | 02 | 2345 | NAA | N-Acetyl Aspartate | 9.10 | mmol/L | 9.10 | 9.10 | mmol/L | PUTAMEN | LEFT | MRS | AcmeModeler V9.0.1 | 2017-05-22 | 10 | 4 | % | |
| 2 | ABC123 | NV | HD01-101 | 21 | 2 | 02 | 2345 | TNAA | Total N-Acetyl Aspartate Compounds | 10.02 | mmol | 10.02 | 10.02 | mmol/L | PUTAMEN | LEFT | MRS | AcmeModeler V9.0.1 | 2017-05-22 | 10 | 5 | % | |
| 3 | ABC123 | NV | HD01-101 | 21 | 3 | 02 | 2345 | INOSM | Myo-Inositol | 17.11 | mmol/L | 17.11 | 17.11 | mmol/L | PUTAMEN | LEFT | MRS | AcmeModeler V9.0.1 | 2017-05-22 | 10 | 8 | % | |
| 4 | ABC123 | NV | HD01-101 | 21 | 4 | 02 | 2345 | GLX | Glutamate and Glutamine | 25.3 | mmol/L | 25.3 | 25.3 | mmol/L | PUTAMEN | LEFT | MRS | AcmeModeler V9.0.1 | 2017-05-22 | 10 | 10 | % | |
| 5 | ABC123 | NV | HD01-101 | 21 | 5 | 02 | 2345 | TCHOL | Total Choline Compounds | 4.2 | mmol/L | 4.2 | 4.2 | mmol/L | PUTAMEN | LEFT | MRS | AcmeModeler V9.0.1 | 2017-05-22 | 10 | 9 | % | |
| 6 | ABC123 | NV | HD01-101 | 21 | 6 | 02 | 2345 | TCREAT | Total Creatine Compounds | 11.5 | mmol/L | 11.5 | 11.5 | mmol/L | PUTAMEN | LEFT | MRS | AcmeModeler V9.0.1 | 2017-05-22 | 10 | 13 | % |
NV NSV Metadata
| Variable | Label | Type | Role | Source | Comments |
|---|---|---|---|---|---|
| NVSNR | Signal to Noise Ratio | Num | Non-Standard Variable Qualifier of Results | eDT | SNR qualifies the entire spectroscopy dataset, but currently there is no dedicated way to represent qualifiers of this intermediate layer of data. |
| NVRCRLB | Relative Cramer-Rao Lower Bound | Char | Non-Standard Variable Qualifier of Results | eDT | The relative Cramer-Rao Lower Bound for the result, expressing the error as a percentage. |
| NVRCRLBU | Relative Cramer-Rao Lower Bound Units | Char | Non-Standard Variable Qualifier of NVRCRLB | eDT | Units for the relative Cramer-Rao lower bound value shown in NVRCRLB (%). |
Identifying information about the MRS imaging device used, including the device type, manufacturer, and model are represented in the DI domain.
di.xpt
| Row | STUDYID | DOMAIN | SPDEVID | DISEQ | DIPARMCD | DIPARM | DIVAL |
|---|---|---|---|---|---|---|---|
| 1 | ABC123 | DI | 21 | 1 | DEVTYPE | Device Type | MRI |
| 2 | ABC123 | DI | 21 | 2 | MANUF | Manufacturer | Acme |
| 3 | ABC123 | DI | 21 | 3 | MODEL | Model | Alpha |
Changeable properties and parameters for devices identified in DI are represented in the Device In-Use (DU) domain. The following example shows the modeling of a set of acquisition parameters for the device that may change between scans. The acquisition parameters focus on those relevant to the spectroscopy data from which the metabolite concentrations shown in the NV example above were obtained. See Example 1 in Section 4.3.1, Magnetic Resonance Imaging (MRI), for additional types of parameters relevant to the anatomical scan. Note that some parameters are relevant to both anatomical and spectroscopy scans.
DUREFID indicates a unique scan, as defined by a changeable set of properties set as indicated for each scan. This value is shared by the value of NVREFID for any findings or conclusions made from this scan. Note that the properties in this example are meant to serve as examples only of properties that could be obtained from a source such as the DICOM file. Sponsors should refer to regulatory guidance and speak to their individual review divisions to determine which parameters should be included in the data submission, and then verify if controlled terminology exists for these parameters.
du.xpt
| Row | STUDYID | DOMAIN | USUBJID | SPDEVID | DUSEQ | DUREFID | DUTESTCD | DUTEST | DUORRES | DUORRESU | VISITNUM | DUDTC |
|---|---|---|---|---|---|---|---|---|---|---|---|---|
| 1 | ABC123 | DU | HD01-101 | 21 | 1 | 2345 | H2OSUPPR | Water Suppression Method | CHESS | 1 | 2017-05-22T12:30 | |
| 2 | ABC123 | DU | HD01-101 | 21 | 2 | 2345 | PULSSEQ | Pulse Sequence | PRESS | 1 | 2017-05-22T12:30 | |
| 3 | ABC123 | DU | HD01-101 | 21 | 3 | 2345 | AQMTRXSZ | Image Acquisition Matrix Size | 1 | VOXEL | 1 | 2017-05-22T12:30 |
| 4 | ABC123 | DU | HD01-101 | 21 | 4 | 2345 | VOXDIMX | X-axis Voxel Dimension | 2.5 | cm | 1 | 2017-05-22T12:30 |
| 5 | ABC123 | DU | HD01-101 | 21 | 5 | 2345 | VOXDIMY | Y-axis Voxel Dimension | 2.5 | cm | 1 | 2017-05-22T12:30 |
| 6 | ABC123 | DU | HD01-101 | 21 | 6 | 2345 | VOXDIMZ | Z-axis Voxel Dimension | 3 | cm | 1 | 2017-05-22T12:30 |
| 7 | ABC123 | DU | HD01-101 | 21 | 7 | 2345 | VOXORIEN | Voxel Orientation | 40 | deg | 1 | 2017-05-22T12:30 |
| 8 | ABC123 | DU | HD01-101 | 21 | 8 | 2345 | ECHOTIME | Echo Time | 30 | msec | 1 | 2017-05-22T12:30 |
| 9 | ABC123 | DU | HD01-101 | 21 | 9 | 2345 | REPTIME | Repetition Time | 4000 | msec | 1 | 2017-05-22T12:30 |
| 10 | ABC123 | DU | HD01-101 | 21 | 10 | 2345 | NUMREPAV | Number of Repeats Averaged | 64 | 1 | 2017-05-22T12:30 | |
| 11 | ABC123 | DU | HD01-101 | 21 | 11 | 2345 | NUMDAPT | Number of Data Points | 2048 | 1 | 2017-05-22T12:30 | |
| 12 | ABC123 | DU | HD01-101 | 21 | 12 | 2345 | USH20AVN | Number of Unsuppressed Water Averages | 16 | 1 | 2017-05-22T12:30 | |
| 13 | ABC123 | DU | HD01-101 | 21 | 13 | 2345 | SPECTWD | Spectral Width | 2 | kHz | 1 | 2017-05-22T12:30 |
Fixed properties for the MRS scanner used are represented in the DO domain. This example shows that coil type was a transmit-receive (TR) head coil with 32 channels and the field strength was 3T.
Note that in the DO example below, "Software Version" is represented as a value for DOTEST, whereas in the NV example above, software name and version number are represented as a concatenated concept in NVANMETH. The software shown in DO below refers to the on-board software running on the imaging device/scanner (i.e., a device property). The software programs used to arrive at the metabolite concentration results in the NV example refer to post-processing analyses; thus, they are not properties of the scanner itself.
do.xpt
| Row | STUDYID | DOMAIN | SPDEVID | DOSEQ | DOTESTCD | DOTEST | DOORRES | DOORRESU |
|---|---|---|---|---|---|---|---|---|
| 1 | ABC123 | DO | 21 | 1 | MRICTYPE | MRI Coil Type | TR Head | |
| 2 | ABC123 | DO | 21 | 2 | NUMCHAN | Number of Channels | 32 | |
| 3 | ABC123 | DO | 21 | 3 | MAGFSTR | Magnetic Field Strength | 3 | T |
| 4 | ABC123 | DO | 21 | 4 | SFTWRVER | Software Version | 3.1 |
The relationship between the MRS scan and the results, and the relationship between the results and the settings of the MRS device, are represented in RELREC. In the simple example presented above, there is 1 subject, 1 device, and 1 scan. Relating records as shown below becomes challenging when there are multiple subjects, devices, and scans represented in the various datasets.
| Rows 1-2: | Link the nervous system result to the particular procedure performed. This indicates that the PRLNKID variable for an individual procedure is linked to multiple NV records via the same value in the NVLNKID variable. |
|---|---|
| Rows 3-5: | Link the nervous system result to the particular scan and properties/settings of the scanner. This describes the procedure components represented related to the multiple NV results and multiple DUTESTs that are represented by the RELREC MANY to MANY relationships between the PRREFID, NVREFID and the DUREFID. |
relrec.xpt
| Row | STUDYID | RDOMAIN | USUBJID | IDVAR | IDVARVAL | RELTYPE | RELID |
|---|---|---|---|---|---|---|---|
| 1 | ABC123 | PR | PRLNKID | MANY | 1 | ||
| 2 | ABC123 | NV | NVLNKID | MANY | 1 | ||
| 3 | ABC123 | PR | PRREFID | MANY | 2 | ||
| 4 | ABC123 | NV | NVREFID | MANY | 2 | ||
| 5 | ABC123 | DU | DUREFID | MANY | 2 |
4.3.3 Positron Emission Tomography (PET)
Unlike volumetric magnetic resonance imaging (MRI) imaging, positron emission tomography (PET) imaging is used to characterize molecular or functional processes in the brain. PET imaging requires the intravenous administration of a radiopharmaceutical (or radiolabeled) tracer to the subject in order to target the region or molecule of interest for imaging. Tracers are specific to the processes they are designed to characterize. These tracers are molecules with radioactive elements designed to bind to specific molecules or be taken up by specific regions of the body. When the tracer accumulates in the region it is designed to bind, the radioactive signal emitted from this target rises relative to the signal emitted from regions it is not designed to bind. PET scanners collect the radioactivity emitted and localize this signal to the region where it has accumulated. These tracers require a specific uptake time—the time from when they were administered to the subject to when the imaging procedure can begin—in order to ensure time is given for them to accumulate at their target location in the brain. Consistent uptake times are required to ensure comparability of results across subjects and visits within a given protocol. These tracers are represented in the Procedure Agents (AG) domain. It is important to record the start time of tracer administration, as well as the start time of the imaging procedure (represented, as in the MRI examples, in the PR domain). This ensures that anyone analyzing the data can determine if uptake time was comparable across observations.
Once the specified uptake time has passed, the PET imaging procedure begins. As in MRI, a single PET procedure may result in multiple scans. As in the MRI examples, the set of changeable properties that define a scan are grouped in the Device In-Use (DU) domain, and linked to the findings in the Nervous System Findings (NV) domain, by using the same --REFID value. PET scanners also have unchanging properties and identifiers analogous to MRI scanners, which are represented in the Device Properties (DO) and Device Identifiers (DI) domains, respectively, as described in Section 4.3.1, Magnetic Resonance Imaging (MRI).
The ultimate endpoint generated by a PET procedure comes in the form of a Standard Uptake Value (SUV) or Standard Uptake Value Ratio (SUVR). SUV is the ratio of radioactivity signal coming from the brain region of interest (which the tracer is designed to target) and the signal coming from the whole body concentration of injected radioactivity. SUVR is a ratio of ratios; it compares the SUV of the region of interest to the SUV of some reference region in the brain. Reference regions are chosen based on the likelihood that the tracer will not be taken up significantly there, and thus serve as a background signal for normalization. In any case, SUV and SUVR are derived from the image as opposed to being direct measurements of radioactivity.
The anatomical data provided by PET scanners are often not sufficient to localize the radioactivity they are designed to image to the level of specificity desired by investigators. For this reason, PET scans are often conducted concurrently with computerized tomography (CT) or with MRI scans, which allow co-registration of more detailed anatomical data with the SUVR data obtained from the PET portion of the image. This is performed concurrently in a single procedure using a hybrid PET/CT or PET/MRI scanner.
It is important to realize that SUVR is based on quantifying regions of signal in a series of images. The only factors that differentiate one SUVR from the next are the region of interest and the tracer used. It is therefore essential to record the region of interest and represent this in the NVLOC variable. Associated qualifiers of NVLOC (NVLAT, NVDIR) may be used where appropriate. It is also essential to maintain the link between the SUVR value (in the NV domain) and the tracer that produced it (in the AG domain).
Uptake of specific tracers in the striatum is an indicator of the functional integrity of the basal ganglia in the brain. Recent development of selective tracers that bind the molecule phosphodiesterase 10A has provided a useful tool for in vivo assessment of striatal neuronal injury and loss. PDE10A is selectively expressed in medium spiny neurons (MSNs). PDE10 levels—as assessed by PET neuroimaging—are reduced early in HD and decline in uptake as HD disease progresses. This process can be detected by the use of PDE10-targeted tracers in longitudinal PET imaging studies.
Hypometabolism is another feature of HD and other neurodegenerative disorders (such as Alzheimer's) that can be assessed via PET. 18F-fluorodeoxyglucose (FDG) is a radiolabeled glucose analog used as a tracer in PET imaging to assess in vivo glucose metabolic activity in the brain. In Alzheimer's disease FDG-PET imaging shows hypometabolism in frontal, temporal, and parietal cortices and can help in differentiating Alzheimer's from other causes of dementia. In HD, decreased cortical metabolism in the early stage of HD is considered indicative of rapid progression. Cortical metabolism in the frontotemporal and parietal cortices has been reported to be significantly lower in patients with early HD with faster progression of the disease as measured using the Unified Huntington's Disease Rating Scale (UHDRS) for clinical outcomes.
The examples in this section illustrate how to represent these various types of data in SDTM-based datasets, and how to maintain and represent the relationship between the tracer administration, the PET procedure, the individual scan properties, and the SUVR findings represented in the NV domain. These examples are only intended to illustrate the data modeling of these various properties and findings, and are not meant to serve as strict requirements or a comprehensive list of the properties and findings which should be provided in a regulatory submission. Sponsors should seek guidance from their regulatory agencies and review divisions regarding which data should be recorded and submitted as appropriate to their individual protocol(s).
The concept map below shows the provenance of a brain physiological or functional measurement (measured as SUVR, represented in the NV domain) of various PET tracers. The process starts with the administration of the tracer, followed by the acquisition of images, and, ultimately, the derivation of the endpoint. Each step of the process shows in high-level detail the different types of data generated that should be represented. Dashed lines lead to the corresponding SDTM domains in which the data generated are represented.
For ease of reading, only the salient concepts are shown. Refer to the individual domain examples referenced in the concept map for detailed views of how the datasets should be populated.
Concept Map. PET Imaging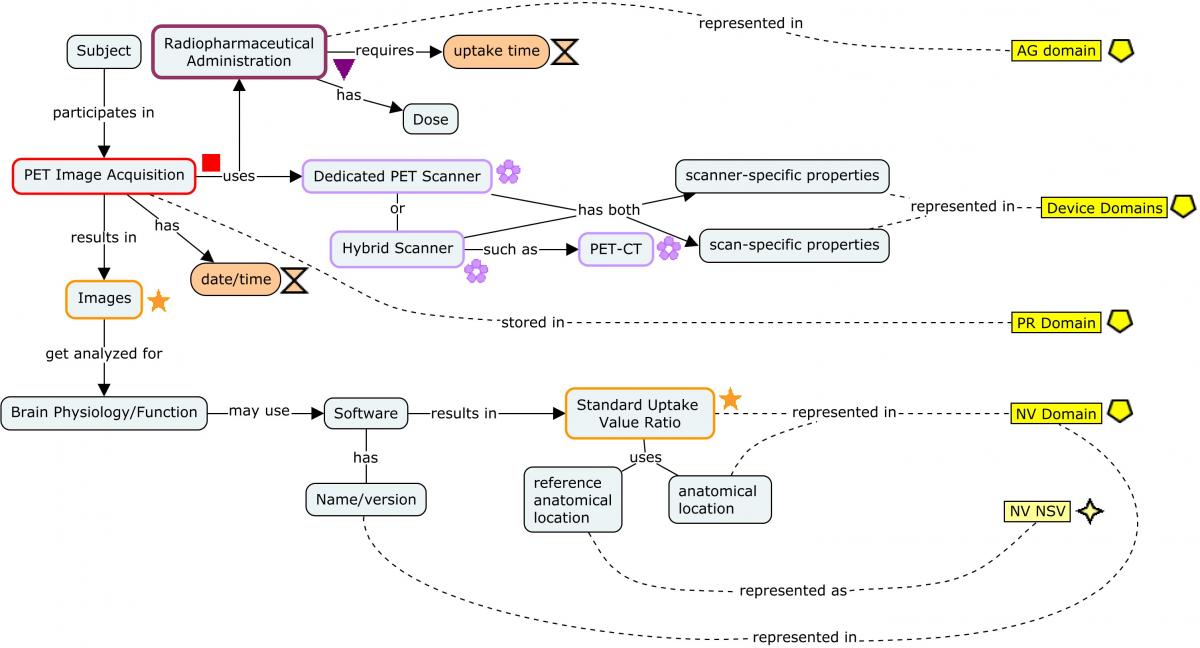
Similar to MRI imaging, PET imaging begins with the imaging procedure, represented in the PR domain. The structure and relationships of the data generated are handled exactly as in the MRI example, except that PET imaging involves the administration of a tracer, which is represented in the AG domain (Concept Map. Relating Records in PET Imaging). In these cases, the LNKID variable serves as a 3-way link between the procedure, the tracer administration, and the results. It is particularly important to maintain the link between AGLNKID and NVLNKID as the tracer information in the AG domain describes the target biomarker being imaged, and on which the SUVR in the NV domain is based. Note that this approach would also work for MRI use cases that involve an exogenous contrast-agent administration. In the PET and PET/CT examples, SPDEVID refers to the PET or PET/CT scanner used.
Concept Map. Relating Records in PET Imaging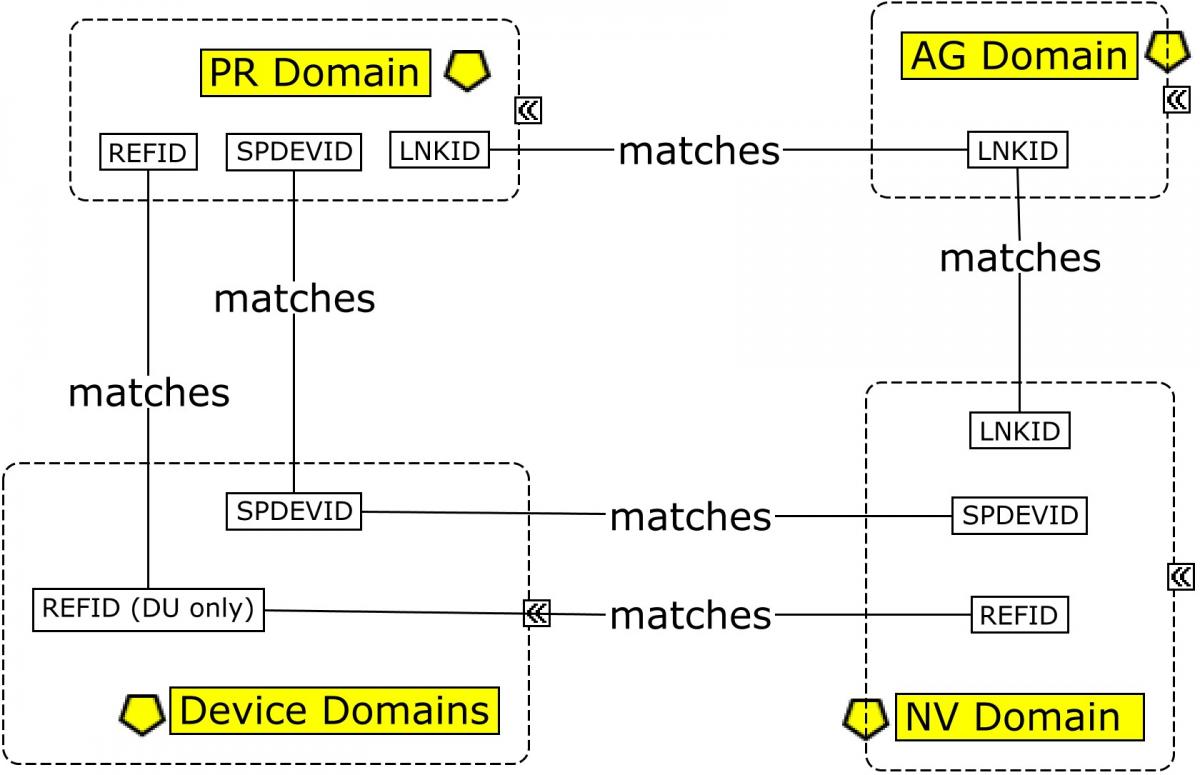
Example
This example shows the modeling of the various pieces of information collected and generated from 3 separate PET procedures, each for a separate subject. Two procedures (for Subjects HD01-101 and HD01-102) showcase striatal binding of 2 different tracers ( 18 F-MNI-659 and 18 F-MNI-654, both of which target phosphodiesterase 10 (PDE10) in the striatum of the brain [5] ) via PET imaging, whereas the third (for Subject HD01-103) shows glucose-metabolism imaging using 18 F-fluorodeoxyglucose (FDG) as the tracer. Data include the procedure records in the PR domain, the administration of the tracer in the Procedure Agents (AG) domain, the SUV and/or SUVR endpoints in the Nervous System Findings (NV) domain, and the various device properties in the respective device domains.
Occurrences of PET procedures are represented in the PR domain. All subjects were fasting at the time of the procedures as indicated by PRFAST=Y. SPDEVID identifies the scanner used in the procedure.
| Rows 1-2: | Show PET head scans for 2 subjects using the same PET scanner, as indicated by the same value of SPDEVID. |
|---|---|
| Row 3: | Shows a PET scan of the head for a third subject using a different scanner (SPDEVID). |
pr.xpt
| Row | STUDYID | DOMAIN | USUBJID | SPDEVID | PRSEQ | PRREFID | PRLNKID | PRTRT | PRLOC | PRFAST | PRSTDTC |
|---|---|---|---|---|---|---|---|---|---|---|---|
| 1 | ABC123 | PR | HD01-101 | 22 | 1 | 1236 | 03 | PET Scan | HEAD | Y | 2017-05-22T09:30 |
| 2 | ABC123 | PR | HD01-102 | 22 | 1 | 1237 | 04 | PET Scan | HEAD | Y | 2017-05-22T08:00 |
| 3 | ABC123 | PR | HD01-103 | 44 | 1 | 1238 | 05 | PET Scan | HEAD | Y | 2017-05-22T09:00 |
Data about the administration of procedure agents such as a radiopharmaceutical tracer for PET scans are represented in the AG domain. The following example shows timing and dosage for tracer substances injected during a PET scan. The relationship between this agent administration and the imaging procedure is shown in the RELREC table. In this example, AGCAT is used to group tracers with the same target. FDG targets glucose metabolism whereas 18F-MNI-659 and 18F-MNI-654 both target phosphodiesterase 10 (PDE10).
ag.xpt
| Row | STUDYID | DOMAIN | USUBJID | AGSEQ | AGLNKID | AGTRT | AGCAT | AGDOSE | AGDOSU | AGSTDTC |
|---|---|---|---|---|---|---|---|---|---|---|
| 1 | ABC123 | AG | HD01-101 | 1 | 03 | 18F-MNI-659 | PDE10 TRACER | 180 | MBq | 2017-05-22T08:40 |
| 2 | ABC123 | AG | HD01-102 | 1 | 04 | 18F-MNI-654 | PDE10 TRACER | 170 | MBq | 2017-05-22T07:20 |
| 3 | ABC123 | AG | HD01-103 | 1 | 05 | FDG | GLUCOSE TRACER | 400 | MBq | 2017-05-22T08:30 |
Data about the nervous system physiology or metabolism, such as measured by PET imaging, are represented in the NV domain.
This example shows 3 SUVR measures taken from 3 PET scans. SPDEVID shows the scanner used. NVLNKID can be used to link to the imaging procedure record in the PR domain (PRLNKID), as well as to the tracer administration record in the AG domain (AGLNKID). AGLNKID is used to determine which tracer uptake is being measured (SUVR), and therefore to which biomarker the findings pertain. NVDTC corresponds to the date of the PET procedure from which these results were obtained. Note the use of NVREFID, which matches the value of DUREFID, which in turn identifies the specific scan from which these findings were determined (see Concept Map. Relating Records in PET Imaging and the DU example which follows for more details).
| Rows 1-2: | Show the SUVR findings based on a PET scan for Subject HD01-101. |
|---|---|
| Rows 3-4: | Show the SUVR findings based on a PET scan for Subject HD01-102. |
| Rows 5-6: | Show the SUVR findings based on an FDG-PET scan for Subject HD01-103. |
nv.xpt
| Row | STUDYID | DOMAIN | USUBJID | SPDEVID | NVSEQ | NVREFID | NVLNKID | NVTESTCD | NVTEST | NVORRES | NVORRESU | NVSTRESC | NVSTRESN | NVSTRESU | NVLOC | NVDIR | NVMETHOD | NVDTC | NVREFREG | |
|---|---|---|---|---|---|---|---|---|---|---|---|---|---|---|---|---|---|---|---|---|
| 1 | ABC123 | NV | HD01-101 | 22 | 1 | 1236 | 03 | SUVR | Standard Uptake Value Ratio | .95 | RATIO | .95 | .95 | RATIO | PUTAMEN | PET SCAN | 2017-05-22 | CEREBELLUM | ||
| 2 | ABC123 | NV | HD01-101 | 22 | 2 | 1236 | 03 | SUVR | Standard Uptake Value Ratio | 1.17 | RATIO | 1.17 | 1.17 | RATIO | CAUDATE NUCLEUS | POSTERIOR | PET SCAN | 2017-05-22 | CEREBELLUM | |
| 3 | ABC123 | NV | HD01-102 | 22 | 1 | 1237 | 04 | SUVR | Standard Uptake Value Ratio | 1.21 | RATIO | 1.21 | 1.21 | RATIO | PUTAMEN | PET SCAN | 2017-05-22 | CEREBELLUM | ||
| 4 | ABC123 | NV | HD01-102 | 22 | 2 | 1237 | 04 | SUVR | Standard Uptake Value Ratio | 1.78 | RATIO | 1.78 | 1.78 | RATIO | CAUDATE NUCLEUS | POSTERIOR | PET SCAN | 2017-05-22 | CEREBELLUM | |
| 5 | ABC123 | NV | HD01-103 | 44 | 1 | 1238 | 05 | SUVR | Standard Uptake Value Ratio | 1.52 | RATIO | 1.52 | 1.52 | RATIO | PUTAMEN | PET SCAN | 2017-05-22 | CEREBELLUM | ||
| 6 | ABC123 | NV | HD01-103 | 44 | 2 | 1238 | 05 | SUVR | Standard Uptake Value Ratio | 1.63 | RATIO | 1.63 | 1.63 | RATIO | CAUDATE NUCLEUS | POSTERIOR | PET SCAN | 2017-05-22 | CEREBELLUM |
NV NSV Metadata
| Variable | Label | Type | Role | Origin | Comments |
|---|---|---|---|---|---|
| NVREFREG | Reference Anatomical Region | Char | Non-Standard Record Qualifier | eDT | In PET imaging, this is the anatomical region from which the standard uptake value serves as the denominator of the standard uptake value ratio |
SUVR is the ratio of the SUV at the region of interest ( SUVROI) and the SUV at the reference region (SUVReference) and is represented as shown in the nv.xpt example above. Alternatively, the individual SUV values may be represented in separate records (with the region of interest and reference regions represented in NVLOC). This approach, shown in the nv.xpt example that follows, would be used if the SUVR is calculated in analysis. The cerebellum is used as reference region in each of the scans indicated by NVREFID. The approach does not explicitly indicate the reference region in the data, and would therefore have to be identified by protocol or statistical analysis plan.
| Rows 1-3: | Show the SUV findings based on a PET scan for Subject HD01-101. |
|---|---|
| Rows 4-6: | Show the SUV findings based on a PET scan for Subject HD01-102. |
| Rows 7-9: | Show the SUV findings based on an FDG-PET scan for Subject HD01-103. |
nv.xpt
| Row | STUDYID | DOMAIN | USUBJID | SPDEVID | NVSEQ | NVREFID | NVLNKID | NVTESTCD | NVTEST | NVORRES | NVORRESU | NVSTRESC | NVSTRESN | NVSTRESU | NVLOC | NVMETHOD | NVDTC |
|---|---|---|---|---|---|---|---|---|---|---|---|---|---|---|---|---|---|
| 1 | ABC123 | NV | HD01-101 | 22 | 1 | 1236 | 03 | SUV | Standard Uptake Value | .95 | RATIO | .95 | .95 | RATIO | PUTAMEN | PET SCAN | 2017-05-22 |
| 2 | ABC123 | NV | HD01-101 | 22 | 2 | 1236 | 03 | SUV | Standard Uptake Value | 1.17 | RATIO | 1.17 | 1.17 | RATIO | CAUDATE NUCLEUS | PET SCAN | 2017-05-22 |
| 3 | ABC123 | NV | HD01-101 | 22 | 3 | 1236 | 03 | SUV | Standard Uptake Value | 1.17 | RATIO | 1.17 | 1.17 | RATIO | CEREBELLUM | PET SCAN | 2017-05-22 |
| 4 | ABC123 | NV | HD01-102 | 22 | 1 | 1237 | 04 | SUV | Standard Uptake Value | 1.21 | RATIO | 1.21 | 1.21 | RATIO | PUTAMEN | PET SCAN | 2017-05-22 |
| 5 | ABC123 | NV | HD01-102 | 22 | 2 | 1237 | 04 | SUV | Standard Uptake Value | 1.78 | RATIO | 1.78 | 1.78 | RATIO | CAUDATE NUCLEUS | PET SCAN | 2017-05-22 |
| 6 | ABC123 | NV | HD01-102 | 22 | 3 | 1237 | 04 | SUV | Standard Uptake Value | 1.78 | RATIO | 1.78 | 1.78 | RATIO | CEREBELLUM | PET SCAN | 2017-05-22 |
| 7 | ABC123 | NV | HD01-103 | 44 | 1 | 1238 | 05 | SUV | Standard Uptake Value | 1.52 | RATIO | 1.52 | 1.52 | RATIO | PUTAMEN | PET SCAN | 2017-05-22 |
| 8 | ABC123 | NV | HD01-103 | 44 | 2 | 1238 | 05 | SUV | Standard Uptake Value | 1.63 | RATIO | 1.63 | 1.63 | RATIO | CAUDATE NUCLEUS | PET SCAN | 2017-05-22 |
| 9 | ABC123 | NV | HD01-103 | 44 | 3 | 1238 | 05 | SUV | Standard Uptake Value | 1.63 | RATIO | 1.63 | 1.63 | RATIO | CEREBELLUM | PET SCAN | 2017-05-22 |
Data about the devices used throughout are represented in the DI domain.
| Rows 1-3: | Describe the PET imaging device used in the Tracer examples shown in the NV domain. |
|---|---|
| Rows 4-6: | Describe the PET imaging device used in the glucose tracer (FDG) example shown in the NV domain. |
di.xpt
| Row | STUDYID | DOMAIN | SPDEVID | DISEQ | DIPARMCD | DIPARM | DIVAL |
|---|---|---|---|---|---|---|---|
| 1 | ABC123 | DI | 22 | 1 | DEVTYPE | Device Type | PET |
| 2 | ABC123 | DI | 22 | 2 | MANUF | Manufacturer | Acme |
| 3 | ABC123 | DI | 22 | 3 | MODEL | Model | Beta+ |
| 4 | ABC123 | DI | 44 | 1 | DEVTYPE | Device Type | PET |
| 5 | ABC123 | DI | 44 | 2 | MANUF | Manufacturer | Acme |
| 6 | ABC123 | DI | 44 | 3 | MODEL | Model | Gamma |
Changeable properties and parameters of the devices identified in DI are represented in the Device In-Use (DU) domain. DUREFID is used to identify each unique scan, as defined by a changeable set of properties that were set as indicated for this scan.
| Rows 1-12: | Show properties of the PET/CT device that were used in a scan of Subject HD01-101. |
|---|---|
| Rows 13-24: | Show properties of the PET/CT device that were used in a scan of Subject HD01-102. |
| Rows 25-36: | Show properties of the PET device that were used in a scan of Subject HD01-103. |
du.xpt
| Row | STUDYID | DOMAIN | USUBJID | SPDEVID | DUSEQ | DUREFID | DUTESTCD | DUTEST | DUORRES | DUORRESU | ... | VISITNUM | DUDTC |
|---|---|---|---|---|---|---|---|---|---|---|---|---|---|
| 1 | ABC123 | DU | HD01-101 | 22 | 1 | 1236 | ANTPLANE | Anatomical Plane | SAGITTAL | ... | 1 | 2017-05-22T09:30 | |
| 2 | ABC123 | DU | HD01-101 | 22 | 2 | 1236 | INTSPACE | Interslice Spacing | 1 | mm | ... | 1 | 2017-05-22T09:30 |
| 3 | ABC123 | DU | HD01-101 | 22 | 3 | 1236 | STHICK | Slice Thickness | 5 | mm | ... | 1 | 2017-05-22T09:30 |
| 4 | ABC123 | DU | HD01-101 | 22 | 4 | 1236 | PIXSPCX | X-axis Pixel Spacing | 2 | mm | ... | 1 | 2017-05-22T09:30 |
| 5 | ABC123 | DU | HD01-101 | 22 | 5 | 1236 | PIXSPCY | Y-axis Pixel Spacing | 2 | mm | ... | 1 | 2017-05-22T09:30 |
| 6 | ABC123 | DU | HD01-101 | 22 | 6 | 1236 | AQMTRXSZ | Image Acquisition Matrix Size | 256X256 | VOXEL | ... | 1 | 2017-05-22T09:30 |
| 7 | ABC123 | DU | HD01-101 | 22 | 7 | 1236 | FLDVIEW | Field of View | 280X280 | mm | ... | 1 | 2017-05-22T09:30 |
| 8 | ABC123 | DU | HD01-101 | 22 | 8 | 1236 | NUMSLICE | Number of Slices | 125 | ... | 1 | 2017-05-22T09:30 | |
| 9 | ABC123 | DU | HD01-101 | 22 | 9 | 1236 | ATTCRCT | Attenuation Correction Type | FBP | ... | 1 | 2017-05-22T09:30 | |
| 10 | ABC123 | DU | HD01-101 | 22 | 10 | 1236 | DECCORR | Decay Correction Indicator | N | ... | 1 | 2017-05-22T09:30 | |
| 11 | ABC123 | DU | HD01-101 | 22 | 11 | 1236 | RANDCORR | Randoms Correction Indicator | N | ... | 1 | 2017-05-22T09:30 | |
| 12 | ABC123 | DU | HD01-101 | 22 | 12 | 1236 | RECONDAT | Reconstruction of Raw Data Type | Iterative | ... | 1 | 2017-05-22T09:30 | |
| 13 | ABC123 | DU | HD01-102 | 22 | 1 | 1237 | ANTPLANE | Anatomical Plane | SAGITTAL | ... | 1 | 2017-05-22T08:00 | |
| 14 | ABC123 | DU | HD01-102 | 22 | 2 | 1237 | INTSPACE | Interslice Spacing | 1 | mm | ... | 1 | 2017-05-22T08:00 |
| 15 | ABC123 | DU | HD01-102 | 22 | 3 | 1237 | STHICK | Slice Thickness | 5 | mm | ... | 1 | 2017-05-22T08:00 |
| 16 | ABC123 | DU | HD01-102 | 22 | 4 | 1237 | PIXSPCX | X-axis Pixel Spacing | 2 | mm | ... | 1 | 2017-05-22T08:00 |
| 17 | ABC123 | DU | HD01-102 | 22 | 5 | 1237 | PIXSPCY | Y-axis Pixel Spacing | 2 | mm | ... | 1 | 2017-05-22T08:00 |
| 18 | ABC123 | DU | HD01-102 | 22 | 6 | 1237 | AQMTRXSZ | Image Acquisition Matrix Size | 256X256 | VOXEL | ... | 1 | 2017-05-22T08:00 |
| 19 | ABC123 | DU | HD01-102 | 22 | 7 | 1237 | FLDVIEW | Field of View | 280X280 | mm | ... | 1 | 2017-05-22T08:00 |
| 20 | ABC123 | DU | HD01-102 | 22 | 8 | 1237 | NUMSLICE | Number of Slices | 125 | ... | 1 | 2017-05-22T08:00 | |
| 21 | ABC123 | DU | HD01-102 | 22 | 9 | 1237 | ATTCRCT | Attenuation Correction Type | FBP | ... | 1 | 2017-05-22T08:00 | |
| 22 | ABC123 | DU | HD01-102 | 22 | 10 | 1237 | DECCORR | Decay Correction Indicator | N | ... | 1 | 2017-05-22T08:00 | |
| 23 | ABC123 | DU | HD01-102 | 22 | 11 | 1237 | RANDCORR | Randoms Correction Indicator | N | ... | 1 | 2017-05-22T08:00 | |
| 24 | ABC123 | DU | HD01-102 | 22 | 12 | 1237 | RECONDAT | Reconstruction of Raw Data Type | Backscatter | ... | 1 | 2017-05-22T08:00 | |
| 25 | ABC123 | DU | HD01-103 | 44 | 1 | 1238 | ANTPLANE | Anatomical Plane | SAGITTAL | ... | 1 | 2017-05-22T09:30 | |
| 26 | ABC123 | DU | HD01-103 | 44 | 2 | 1238 | INTSPACE | Interslice Spacing | 1 | mm | ... | 1 | 2017-05-22T09:30 |
| 27 | ABC123 | DU | HD01-103 | 44 | 3 | 1238 | STHICK | Slice Thickness | 5 | mm | ... | 1 | 2017-05-22T09:30 |
| 28 | ABC123 | DU | HD01-103 | 44 | 4 | 1238 | PIXSPCX | X-axis Pixel Spacing | 2 | mm | ... | 1 | 2017-05-22T09:30 |
| 29 | ABC123 | DU | HD01-103 | 44 | 5 | 1238 | PIXSPCY | Y-axis Pixel Spacing | 2 | mm | ... | 1 | 2017-05-22T09:30 |
| 30 | ABC123 | DU | HD01-103 | 44 | 6 | 1238 | AQMTRXSZ | Image Acquisition Matrix Size | 256X256 | PIXEL | ... | 1 | 2017-05-22T09:30 |
| 31 | ABC123 | DU | HD01-103 | 44 | 7 | 1238 | FLDVIEW | Field of View | 280X280 | mm | ... | 1 | 2017-05-22T09:30 |
| 32 | ABC123 | DU | HD01-103 | 44 | 8 | 1238 | NUMSLICE | Number of Slices | 125 | ... | 1 | 2017-05-22T09:30 | |
| 33 | ABC123 | DU | HD01-103 | 44 | 9 | 1238 | ATTCRCT | Attenuation Correction Type | FBP | ... | 1 | 2017-05-22T09:30 | |
| 34 | ABC123 | DU | HD01-103 | 44 | 10 | 1238 | DECCORR | Decay Correction Indicator | N | ... | 1 | 2017-05-22T09:30 | |
| 35 | ABC123 | DU | HD01-103 | 44 | 11 | 1238 | RANDCORR | Randoms Correction Indicator | N | ... | 1 | 2017-05-22T09:30 | |
| 36 | ABC123 | DU | HD01-103 | 44 | 12 | 1238 | RECONDAT | Reconstruction of Raw Data Type | Backscatter | ... | 1 | 2017-05-22T09:30 |
Fixed properties of devices identified in DI are represented in the Device Properties (DO) domain.
| Rows 1-2: | Show properties of the PET scanner used. |
|---|---|
| Rows 3-4: | Show properties of the PET scanner used. |
do.xpt
| Row | STUDYID | DOMAIN | SPDEVID | DOSEQ | DOTESTCD | DOTEST | DOORRES | DOORRESU |
|---|---|---|---|---|---|---|---|---|
| 1 | ABC123 | DO | 22 | 1 | SCRYSTYP | Scintillation Crystal Type | Bismuth Germanium Oxide | |
| 2 | ABC123 | DO | 22 | 2 | SFTWRVER | Software Version | 5.1 | |
| 3 | ABC123 | DO | 44 | 1 | SCRYSTYP | Scintillation Crystal Type | Bismuth Germanium Oxide | |
| 4 | ABC123 | DO | 44 | 2 | SFTWRVER | Software Version | 5.1 |
The RELREC table that follows uses --LNKID to relate the PR and AG domains to each other and to NV and --REFID to relate NV and DU.
In this example, the sponsor has maintained 2 sets of reference identifiers for the specific purpose of being able to relate records across multiple domains. Because the SDTMIG-MD v1.0 advocates the use of --REFID to link a group of settings to the results obtained from the reading or interpretation of the test (see the SDTMIG-MD v1.0, Section 4.2.1, Assumption 8), --LNKID has been used to establish the relationships between the procedure, the substance administered during the procedure, and the results obtained from the procedure. --LNKID is unique for each procedure for each subject, so datasets may be related to each other as a whole.
| Rows 1-2: | Show the relationship between the scan, represented in PR, and the radiolabel tracer used, represented in AG. There is only 1 tracer administration for each scan, and only 1 scan for each tracer administration, so the relationship is ONE to ONE. |
|---|---|
| Rows 3-4: | Show the relationship between the scan, represented in PR, and the SUVR results obtained from the scan, represented in NV. Each scan yields 2 results, so the relationship is ONE to MANY. |
| Rows 5-6: | Show the relationship between the radiolabel tracer used and the SUVR results for each scan. This relationship may seem indirect, but it is not: The choice of radiolabel has the potential to affect the results obtained. Because the relationship between PR and AG is ONE to ONE and the relationship between PR and NV is ONE to MANY, the relationship between AG and NV must be ONE to MANY. |
| Rows 7-9: | Show the relationship between the SUVR results and the specific settings for the device used for each scan. This example shows only 1 scan per patient and therefore ONE scan to MANY NV results and MANY DU settings. |
relrec.xpt
| Row | STUDYID | RDOMAIN | USUBJID | IDVAR | IDVARVAL | RELTYPE | RELID |
|---|---|---|---|---|---|---|---|
| 1 | ABC123 | PR | PRLNKID | ONE | 6 | ||
| 2 | ABC123 | AG | AGLNKID | ONE | 6 | ||
| 3 | ABC123 | PR | PRLNKID | ONE | 7 | ||
| 4 | ABC123 | NV | NVLNKID | MANY | 7 | ||
| 5 | ABC123 | AG | AGLNKID | ONE | 8 | ||
| 6 | ABC123 | NV | NVLNKID | MANY | 8 | ||
| 7 | ABC123 | PR | PRREFID | ONE | 9 | ||
| 8 | ABC123 | NV | NVREFID | MANY | 9 | ||
| 9 | ABC123 | DU | DUREFID | MANY | 9 |
Appendices
Appendix A: Huntington's Disease Team
| Name | Institution/Organization |
|---|---|
| Jon Neville, Lead | CDISC |
| Daniel Olson | C-Path |
| Laura Butte, PM | C-Path |
| Maryam Abaei | IXICO |
| Dana Booth | CDISC |
| Marc Ciosi | University of Glasgow |
| Diane Corey | C-Path |
| Cheryl Fitzer-Attas | ClinMed LLC |
| Darren Freeman | CHDI |
| Rebecca Fuller | CHDI |
| Emily Gantman | CHDI |
| Emily Hartley | C-Path |
| Derek Hill | UCL |
| Beth Hoffman | Origami Therapeutics |
| Torsten Illmann | 2mt-software |
| Bernhard Landwehrmeyer | University Hospital of Ulm |
| Doug Langbehn | University of Iowa |
| Blair Leavitt | The University of British Columbia (UBC) |
| David Lythgoe | King's College London |
| Alex MacKay | UBC MRI Research Centre |
| Darren Monckton | University of Glasgow |
| Erin Muhlbradt | NCI-EVS |
| Eileen Neacy | CHDI |
| Gerald Podskalny | FDA |
| Dorian Pustina | CHDI Foundation |
| David Russell | Institute of Neurodegenerative Diseases |
| Bretta Russell-Schulz | UBC MRI Research Centre |
| Cristina Sampaio | CHDI |
| Julie Stout | Monash |
Appendix B: Glossary and Abbreviations
| ADaM | Analysis Data Model |
| Allele | One of the possible alternative forms of a gene present at a given locus |
| Autosomal | Of genes/genotypes: refers to those that occur on one of the pairs of non-sex chromosomes |
| CDASH | Clinical Data Acquisition Standards Harmonization Project |
| CDISC | Clinical Data Interchange Standards Consortium |
| CFAST | Coalition for Accelerating Standards and Therapies |
| Collected | Information that is recorded and/or transmitted to the sponsor. This includes data entered by the site on case report forms as well as vendor data such as core lab data. This term is a synonym for captured. |
| Controlled Terminology | A finite set of values that represent the only allowed values for a data item. These values may be codes, text, or numeric. A codelist is one type of controlled terminology. |
| CSF | Cerebrospinal fluid |
| CT | Computerized tomography; an imaging technique |
| Domain | A collection of observations with a topic-specific commonality about a subject |
| Dominant | Of alleles/mutations in genotypes, refers to a variant that is expressed phenotypically even if present in only of the two copies of a given locus. |
| Foundational Standards | Used to refer to the suite of CDISC standards that describe the clinical study protocol (Protocol), design (Study Design), data collection (CDASH), laboratory work (Lab), analysis (ADaM), and data tabulation (SDTM and SEND). See http://www.cdisc.org/ for more information on each of these clinical data standards. |
| HD | Huntington's disease |
| HDCAC | HD-causing allele carrier |
| MRI | Magnetic resonance imaging; an imaging technique |
| MRS | Magnetic resonance spectroscopy |
| MSN | Medium spiny neuron |
| NFL | Neurofilament light chain |
| NIH | National Institutes of Health |
| Nucleotide | A building block of DNA; either cytosine, adenine, guanine, or tyrosine, abbreviated as C, A, G, and T, respectively |
| Penetrance | The extent to which a genotype is expressed phenotypically |
| PET | Positron emission tomography, an imaging technique |
| SDTM | Study Data Tabulation Model |
| SDTMIG | SDTM Implementation Guide (for Human Clinical Trials) |
| SNP | Single nucleotide polymorphism |
| SUV | Standard Uptake Value |
| SUVR | Standard Uptake Value Ratio |
| Subject | A participant in a study |
| TAUG | Therapeutic Area User Guide |
| UHDRS | Unified Huntington's Disease Rating Scale |
Appendix C: Non-Standard Variables
| Parent Domain | Variable | Label | SAS Data Type | XML Data Type | Codelist/Controlled Terms | Role | Description | Comments |
|---|---|---|---|---|---|---|---|---|
| NV | --RCRLB | Relative Cramer-Rao Lower Bound | Num | float | Non-Standard Variable Qualifier of Results | RCRLB is a statistic representing the lower bound on the variance of an unbiased estimator. | ||
| NV | --RCRLBU | Relative Cramer-Rao Lower Bound Units | Char | text | Non-Standard Variable Qualifier of --RCRLB | Units for the relative Cramer-Rao lower bound value shown in --RCRLB | RCRLB is generally expressed as a percentage (%). | |
| NV | --REFREG | Reference Anatomical Region | Char | text | (LOC) | Non-Standard Record Qualifier | An anatomical region that is used for comparison or normalization in an assessment of some target region of interest | The SUVR generated as part of a PET scan is the ratio of the SUV at the region of interest (SUVROI) and the SUV at the reference region (SUVReference). For example, the CEREBELLUM may be used as a reference region in this context. |
| BE | --SPEC | Specimen Type | Char | text | (SPECTYPE) | Non-Standard Record Qualifier | Defines the type of specimen used for a measurement. Examples: SERUM, PLASMA, URINE | |
| NV | --SNR | Signal to Noise Ratio | Num | float | Non-Standard Variable Qualifier of Results | The ratio of the intensity of the data that is of interest (signal) to the intensity of the noise | Signal to noise may qualify an entire dataset from which multiple results are obtained. In these cases, the same value of SNR would be represented on each record of findings from that dataset. This is not ideal but there are currently no defined ways in SDTM for representing details on "intermediate" levels of data (data that exist between time of assessment and time of determination of results). |
(Parenthesis indicates CDISC/NCI codelist)
Appendix D: References
Works Cited
- Ross CA, Aylward EH, Wild EJ, et al. Huntington disease: natural history, biomarkers and prospects for therapeutics. Nature Rev Neurol, 2014;10(4):204-216. doi:10.1038/nrneurol.2014.24
- Warby SC, Graham RK, Hayden MR. Huntington disease. In: Adam MP, Ardinger HH, Pagon RA, et al., eds., GeneReviews. Seattle, WA: University of Washington. https://www.ncbi.nlm.nih.gov/books/NBK1305/. Published October 23, 1998. Updated July 5, 2018. Accessed September 5, 2018.
- Byrne LM, Wild EJ. Cerebrospinal fluid biomarkers for Huntington's disease. J Huntingtons Dis, 2016;5(1):1-13. doi:10.3233/JHD-160196
- Georgiou-Karistianis N, Scahill R, Tabrizi SJ, Squitieri F, Aylward E. Structural MRI in Huntington's disease and recommendations for its potential use in clinical trials. Neurosci Biobehav Rev, 2013;37(3):480-490. doi:10.1016/j.neubiorev.2013.01.022
- Russell DS, Jennings DL, Barret O, et al. Change in PDE10 across early Huntington disease assessed by [18F]MNI-659 and PET imaging. Neurology, 2016;86(8):748-754. doi:10.1212/WNL.0000000000002391
Appendix E: Representations and Warranties, Limitations of Liability, and Disclaimers
CDISC Patent Disclaimers
It is possible that implementation of and compliance with this standard may require use of subject matter covered by patent rights. By publication of this standard, no position is taken with respect to the existence or validity of any claim or of any patent rights in connection therewith. CDISC, including the CDISC Board of Directors, shall not be responsible for identifying patent claims for which a license may be required in order to implement this standard or for conducting inquiries into the legal validity or scope of those patents or patent claims that are brought to its attention.
Representations and Warranties
"CDISC grants open public use of this User Guide (or Final Standards) under CDISC's copyright."
Each Participant in the development of this standard shall be deemed to represent, warrant, and covenant, at the time of a Contribution by such Participant (or by its Representative), that to the best of its knowledge and ability: (a) it holds or has the right to grant all relevant licenses to any of its Contributions in all jurisdictions or territories in which it holds relevant intellectual property rights; (b) there are no limits to the Participant's ability to make the grants, acknowledgments, and agreements herein; and (c) the Contribution does not subject any Contribution, Draft Standard, Final Standard, or implementations thereof, in whole or in part, to licensing obligations with additional restrictions or requirements inconsistent with those set forth in this Policy, or that would require any such Contribution, Final Standard, or implementation, in whole or in part, to be either: (i) disclosed or distributed in source code form; (ii) licensed for the purpose of making derivative works (other than as set forth in Section 4.2 of the CDISC Intellectual Property Policy ("the Policy")); or (iii) distributed at no charge, except as set forth in Sections 3, 5.1, and 4.2 of the Policy. If a Participant has knowledge that a Contribution made by any Participant or any other party may subject any Contribution, Draft Standard, Final Standard, or implementation, in whole or in part, to one or more of the licensing obligations listed in Section 9.3, such Participant shall give prompt notice of the same to the CDISC President who shall promptly notify all Participants.
No Other Warranties/Disclaimers. ALL PARTICIPANTS ACKNOWLEDGE THAT, EXCEPT AS PROVIDED UNDER SECTION 9.3 OF THE CDISC INTELLECTUAL PROPERTY POLICY, ALL DRAFT STANDARDS AND FINAL STANDARDS, AND ALL CONTRIBUTIONS TO FINAL STANDARDS AND DRAFT STANDARDS, ARE PROVIDED "AS IS" WITH NO WARRANTIES WHATSOEVER, WHETHER EXPRESS, IMPLIED, STATUTORY, OR OTHERWISE, AND THE PARTICIPANTS, REPRESENTATIVES, THE CDISC PRESIDENT, THE CDISC BOARD OF DIRECTORS, AND CDISC EXPRESSLY DISCLAIM ANY WARRANTY OF MERCHANTABILITY, NONINFRINGEMENT, FITNESS FOR ANY PARTICULAR OR INTENDED PURPOSE, OR ANY OTHER WARRANTY OTHERWISE ARISING OUT OF ANY PROPOSAL, FINAL STANDARDS OR DRAFT STANDARDS, OR CONTRIBUTION.
Limitation of Liability
IN NO EVENT WILL CDISC OR ANY OF ITS CONSTITUENT PARTS (INCLUDING, BUT NOT LIMITED TO, THE CDISC BOARD OF DIRECTORS, THE CDISC PRESIDENT, CDISC STAFF, AND CDISC MEMBERS) BE LIABLE TO ANY OTHER PERSON OR ENTITY FOR ANY LOSS OF PROFITS, LOSS OF USE, DIRECT, INDIRECT, INCIDENTAL, CONSEQUENTIAL, OR SPECIAL DAMAGES, WHETHER UNDER CONTRACT, TORT, WARRANTY, OR OTHERWISE, ARISING IN ANY WAY OUT OF THIS POLICY OR ANY RELATED AGREEMENT, WHETHER OR NOT SUCH PARTY HAD ADVANCE NOTICE OF THE POSSIBILITY OF SUCH DAMAGES.
Note: The CDISC Intellectual Property Policy can be found at: cdisc_policy_003_intellectual_property_v201408.pdf.