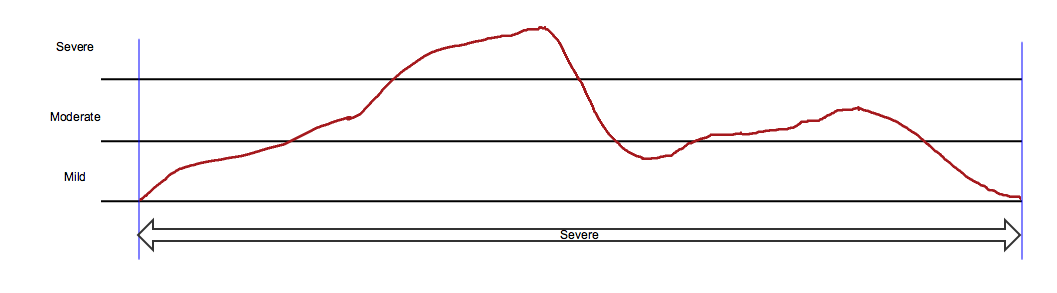
In the diagrams below, the red line represents a graph of severity over time for a hypothetical event. For most adverse events, severity cannot be measured on a continuous scale; this line represents hypothetical actual severity, not data that could be recorded. The horizontal lines divide severity into the three categories, "Mild", "Moderate", and "Severe", which are used to describe adverse event severity.
The SDTM standard event qualifier variable --SEV, Severity/Intensity, can represent only one severity value, even if, as in this hypothetical example, the severity of an event changed over time. A sponsor may decide not to capture data about changes in severity for an event. In this case, sponsors typically populate AESEV or CESEV with the maximum severity over the course of the event, as this represents the worst case.
In the example below, the double-headed arrow represents data collection in which the maximum severity over the entire course of the event was recorded. The arrow extends from the start of the event, --STDTC, marked by the first vertical blue line, to the end of the event, --ENDTC, marked by the second vertical blue line. The text in the arrow shows that --SEV was recorded as "Severe".
The example dataset below shows an AE record consistent with the diagram. Note: this example dataset omits many required and expected values.
| Row | STUDYID | DOMAIN | USUBJID | AESEQ | AESPID | AETERM | AEDECOD | AESEV | AESTDTC | AEENDTC |
|---|---|---|---|---|---|---|---|---|---|---|
| 1 | ABC-123 | AE | 101 | 1 | 1 | NAUSEA | Nausea | SEVERE | 2019-04-15 | 2019-07-10 |
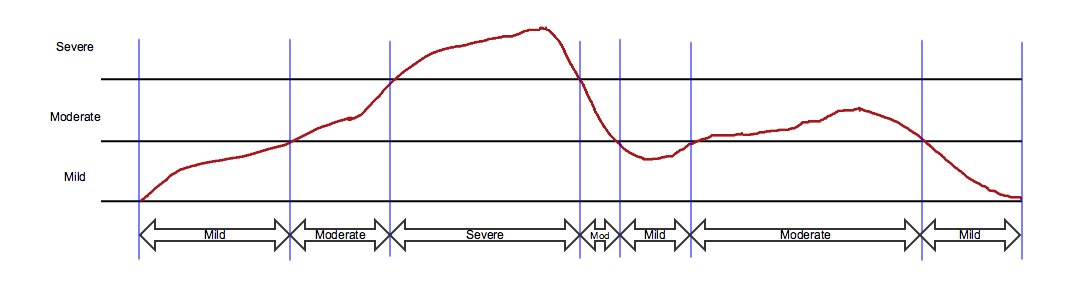
The next three examples show approaches to collecting the changing severity of events. In the diagrams below, blue vertical lines indicate times represented in records in an SDTMIG domain. Text in the arrows show values of --SEV.
1) The SDTMIG assumptions for the AE domain allow a sponsor to define an event. One common approach is to define an event as a condition at a certain severity level and to collect the starts and ends of time periods during which the condition is at each severity level.
This approach, as shown in the diagram below, would result in seven event records, represented by the double-headed arrows. The vertical blue lines indicate the times when severity changed. The arrows extend from the start (--STDTC) to the end (--ENDTC) of the event, while the text in the arrow is the value of --SEV for that period of time. All seven records would be identical aside from the values of --STDTC, --ENDTC, and --SEV.
Variations on this approach define an event based on other properties (e.g., seriousness, relation to study treatment, action taken with study treatment), as well as on severity. Examples of these more complex definitions are not shown.
The following example dataset is consistent with the diagram above. The sponsor used AEGRPID to group records for the overall event.
| Row | STUDYID | DOMAIN | USUBJID | AESEQ | AESPID | AEGRPID | AETERM | AEDECOD | AESEV | AESTDTC | AEENDTC |
|---|---|---|---|---|---|---|---|---|---|---|---|
| 1 | ABC-123 | AE | 101 | 1 | 1 | 1 | NAUSEA | Nausea | MILD | 2019-04-15 | 2019-04-28 |
| 2 | ABC-123 | AE | 101 | 2 | 2 | 1 | NAUSEA | Nausea | MODERATE | 2019-04-28 | 2019-05-09 |
| 3 | ABC-123 | AE | 101 | 3 | 3 | 1 | NAUSEA | Nausea | SEVERE | 2019-05-09 | 2019-05-29 |
| 4 | ABC-123 | AE | 101 | 4 | 4 | 1 | NAUSEA | Nausea | MODERATE | 2019-05-29 | 2019-06-03 |
| 5 | ABC-123 | AE | 101 | 5 | 5 | 1 | NAUSEA | Nausea | MILD | 2019-06-03 | 2019-06-09 |
| 6 | ABC-123 | AE | 101 | 6 | 6 | 1 | NAUSEA | Nausea | MODERATE | 2019-06-09 | 2019-06-27 |
| 7 | ABC-123 | AE | 101 | 7 | 7 | 1 | NAUSEA | Nausea | MILD | 2019-06-27 | 2019-07-10 |
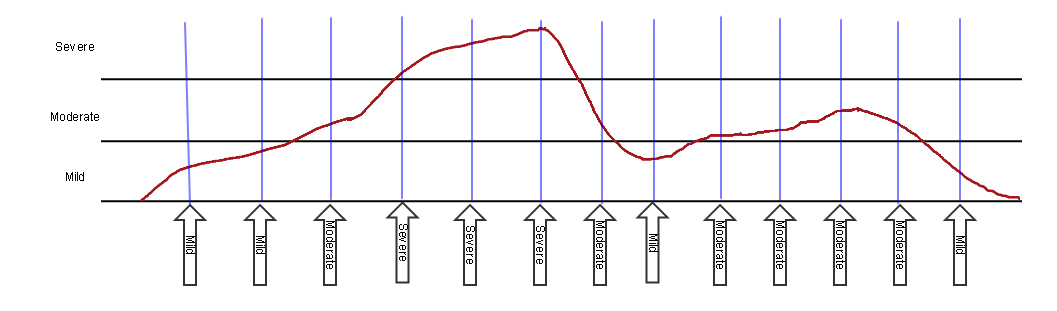
Another approach, sometimes called the "snapshot" approach, is to collect severity at pre-specified points in time. In this approach, the multiple values of severity are represented as findings about the event in the FA domain, with one record for each assessment time point.
The vertical blue lines indicate the times of assessment, which would be represented in FADTC. The values of --SEV are shown in the vertical arrows at the bottom of the blue lines. The arrows are vertical since they reflect a point in time, the time of assessment, represented in FADTC. The text in the arrow is the value of FAORRES where FATEST = "Severity/Intensity".
The following dataset is consistent with the diagram for the snapshot approach in the diagram above. This dataset would be in addition to a record in the AE dataset, as in the first dataset above.
| Row | STUDYID | DOMAIN | USUBJID | FASEQ | FAGRPID | FATESTCD | FATEST | FAOBJ | FAORRES | FASTRESC | FADTC |
|---|---|---|---|---|---|---|---|---|---|---|---|
| 1 | ABC-127 | FAAE | 101 | 1 | 1 | SEV | Severity/Intensity | NAUSEA | MILD | MILD | 2019-04-16 |
| 2 | ABC-127 | FAAE | 101 | 2 | 1 | SEV | Severity/Intensity | NAUSEA | MILD | MILD | 2019-04-23 |
| 3 | ABC-127 | FAAE | 101 | 3 | 1 | SEV | Severity/Intensity | NAUSEA | MODERATE | MODERATE | 2019-04-30 |
| 4 | ABC-127 | FAAE | 101 | 4 | 1 | SEV | Severity/Intensity | NAUSEA | SEVERE | SEVERE | 2019-05-07 |
| 5 | ABC-127 | FAAE | 101 | 5 | 1 | SEV | Severity/Intensity | NAUSEA | SEVERE | SEVERE | 2019-05-14 |
| 6 | ABC-127 | FAAE | 101 | 6 | 1 | SEV | Severity/Intensity | NAUSEA | SEVERE | SEVERE | 2019-05-21 |
| 7 | ABC-127 | FAAE | 101 | 7 | 1 | SEV | Severity/Intensity | NAUSEA | MODERATE | MODERATE | 2019-05-28 |
| 8 | ABC-127 | FAAE | 101 | 8 | 1 | SEV | Severity/Intensity | NAUSEA | MILD | MILD | 2019-06-04 |
| 9 | ABC-127 | FAAE | 101 | 9 | 1 | SEV | Severity/Intensity | NAUSEA | MODERATE | MODERATE | 2019-06-11 |
| 10 | ABC-127 | FAAE | 101 | 10 | 1 | SEV | Severity/Intensity | NAUSEA | MODERATE | MODERATE | 2019-06-18 |
| 11 | ABC-127 | FAAE | 101 | 11 | 1 | SEV | Severity/Intensity | NAUSEA | MODERATE | MODERATE | 2019-06-25 |
| 12 | ABC-127 | FAAE | 101 | 12 | 1 | SEV | Severity/Intensity | NAUSEA | MILD | MILD | 2019-07-02 |
| 13 | ABC-127 | FAAE | 101 | 13 | 1 | SEV | Severity/Intensity | NAUSEA | MILD | MILD | 2019-07-09 |
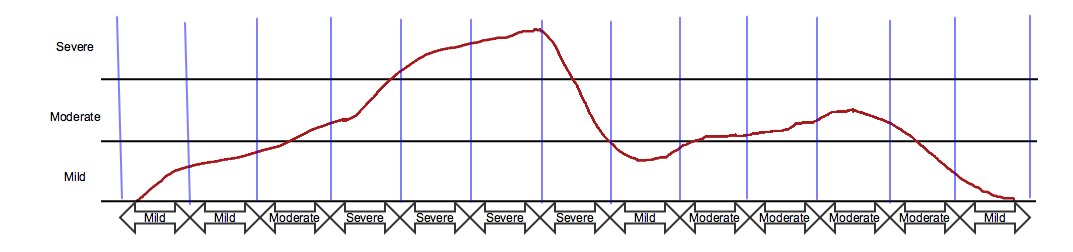
Divide time into a series of pre-specified periods of time and summarize severity over each period.
This approach, sometimes called the "slice" approach, would result in multiple findings about the event, as shown in the example below. At each assessment time, represented by a vertical blue line, severity is summarized over the time since the last assessment. The assessment time is represented in FADTC, and the time period over which severity is summarized is represented as the evaluation interval, FAEVLINT. The summary over the evaluation interval is the maximum severity during that time period. The double-headed arrows end at FADTC and start earlier by FAEVLINT; the text in the arrow is the value of FAORRES where FATEST = "Severity/Intensity".
This approach is often used to track severity of symptoms of the disease under study in patient diaries or in assessments at each visit.
This dataset would be in addition to a record in the AE dataset, as in the first dataset above. Note: the evaluation interval for these records is represented by FAEVLINT = "-P7D". If these assessments were collected at weekly visits, and the actual days of visits might vary from planned, the evaluation interval might be represented using FADTC and FAEVINTX = "SINCE LAST VISIT".
| Row | STUDYID | DOMAIN | USUBJID | FASEQ | FAGRPID | FATESTCD | FATEST | FAOBJ | FAORRES | FASTRESC | FADTC | FAEVLINT |
|---|---|---|---|---|---|---|---|---|---|---|---|---|
| 1 | ABC-127 | FAAE | 101 | 1 | 1 | SEV | Severity/Intensity | NAUSEA | MILD | MILD | 2019-04-16 | -P7D |
| 2 | ABC-127 | FAAE | 101 | 2 | 1 | SEV | Severity/Intensity | NAUSEA | MILD | MILD | 2019-04-23 | -P7D |
| 3 | ABC-127 | FAAE | 101 | 3 | 1 | SEV | Severity/Intensity | NAUSEA | MODERATE | MODERATE | 2019-04-30 | -P7D |
| 4 | ABC-127 | FAAE | 101 | 4 | 1 | SEV | Severity/Intensity | NAUSEA | MODERATE | MODERATE | 2019-05-07 | -P7D |
| 5 | ABC-127 | FAAE | 101 | 5 | 1 | SEV | Severity/Intensity | NAUSEA | SEVERE | SEVERE | 2019-05-14 | -P7D |
| 6 | ABC-127 | FAAE | 101 | 6 | 1 | SEV | Severity/Intensity | NAUSEA | SEVERE | SEVERE | 2019-05-21 | -P7D |
| 7 | ABC-127 | FAAE | 101 | 7 | 1 | SEV | Severity/Intensity | NAUSEA | SEVERE | SEVERE | 2019-05-28 | -P7D |
| 8 | ABC-127 | FAAE | 101 | 8 | 1 | SEV | Severity/Intensity | NAUSEA | MODERATE | MODERATE | 2019-06-04 | -P7D |
| 9 | ABC-127 | FAAE | 101 | 9 | 1 | SEV | Severity/Intensity | NAUSEA | MODERATE | MODERATE | 2019-06-11 | -P7D |
| 10 | ABC-127 | FAAE | 101 | 10 | 1 | SEV | Severity/Intensity | NAUSEA | MODERATE | MODERATE | 2019-06-18 | -P7D |
| 11 | ABC-127 | FAAE | 101 | 11 | 1 | SEV | Severity/Intensity | NAUSEA | MODERATE | MODERATE | 2019-06-25 | -P7D |
| 12 | ABC-127 | FAAE | 101 | 12 | 1 | SEV | Severity/Intensity | NAUSEA | MILD | MILD | 2019-07-02 | -P7D |
| 13 | ABC-127 | FAAE | 101 | 13 | 1 | SEV | Severity/Intensity | NAUSEA | MILD | MILD | 2019-07-09 | -P7D |